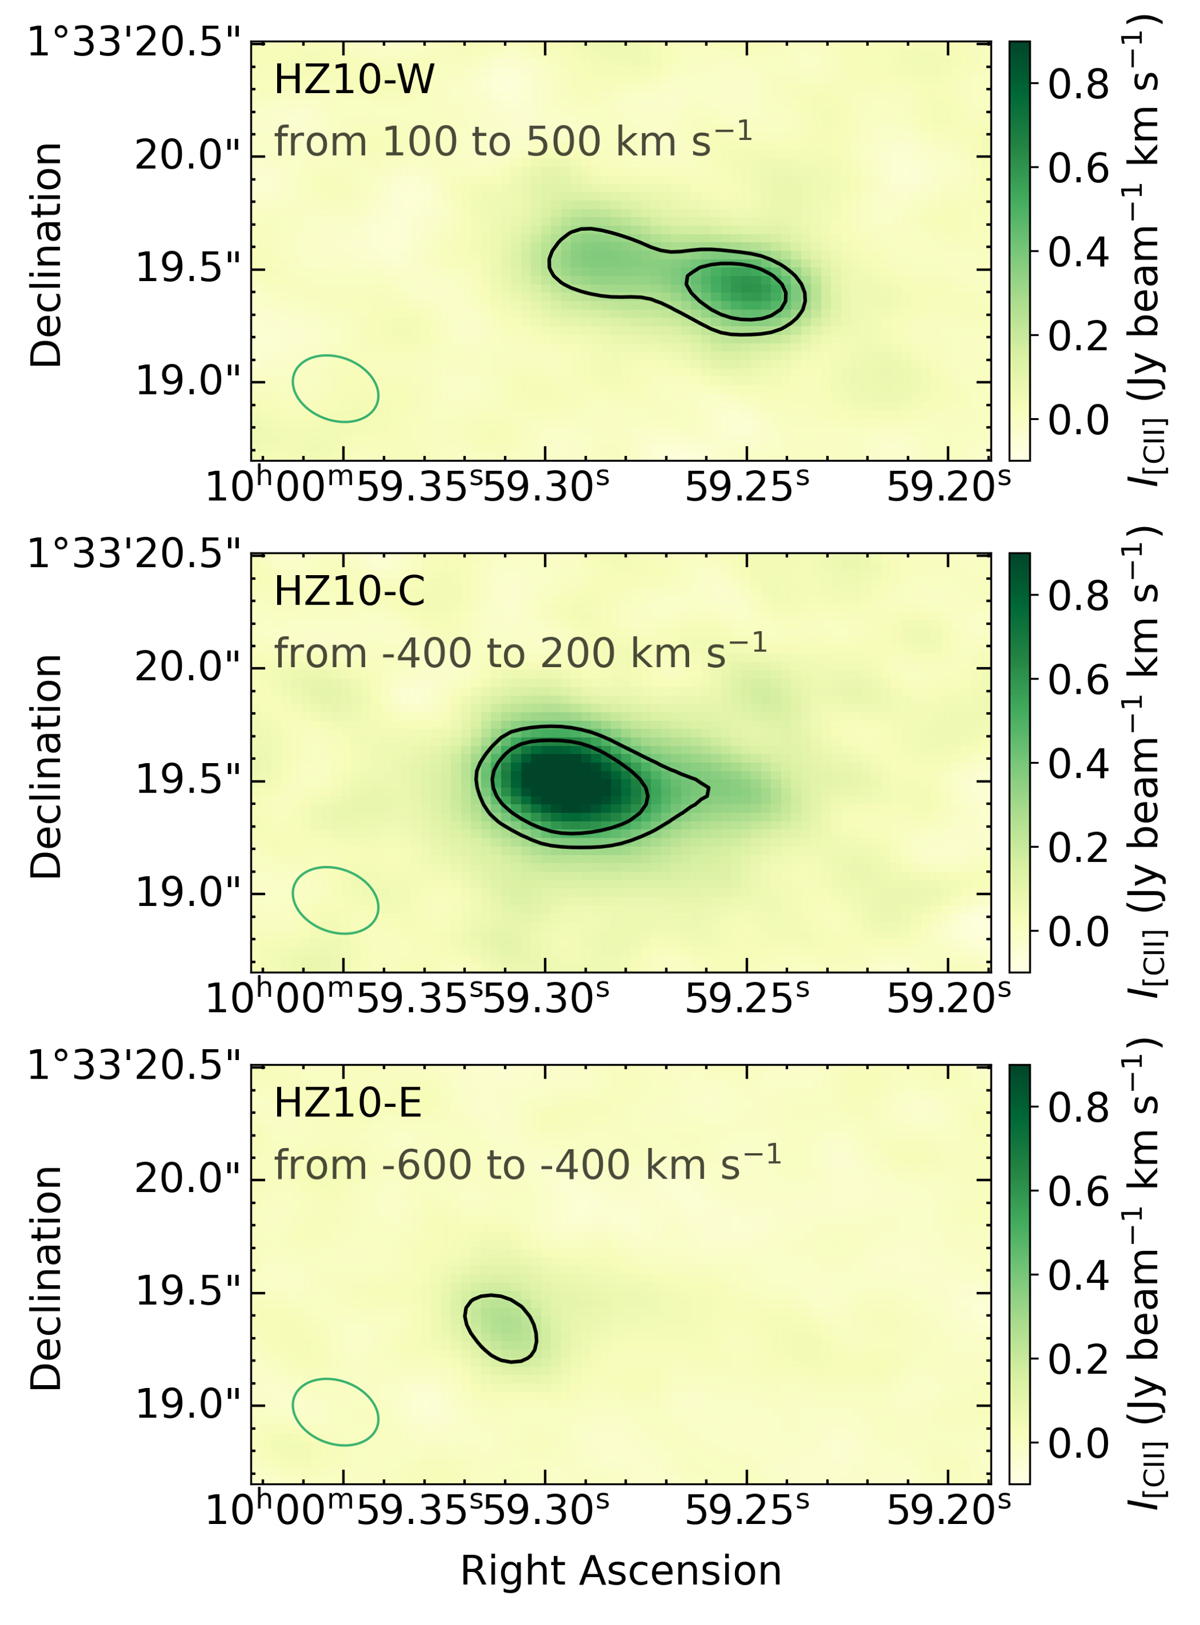
Fig. 5.
Download original image
Integrated [C II] intensity calculated within specific velocity ranges, defined from the PV diagram along the main axis of the HZ10 complex. Contours correspond to the 10σ and 15σ noise levels of the corresponding moment-0 maps. The beam size of the ALMA observations is shown with the green ellipse at the bottom-left corner of each panel.
Current usage metrics show cumulative count of Article Views (full-text article views including HTML views, PDF and ePub downloads, according to the available data) and Abstracts Views on Vision4Press platform.
Data correspond to usage on the plateform after 2015. The current usage metrics is available 48-96 hours after online publication and is updated daily on week days.
Initial download of the metrics may take a while.