Fig. 2.
Download original image
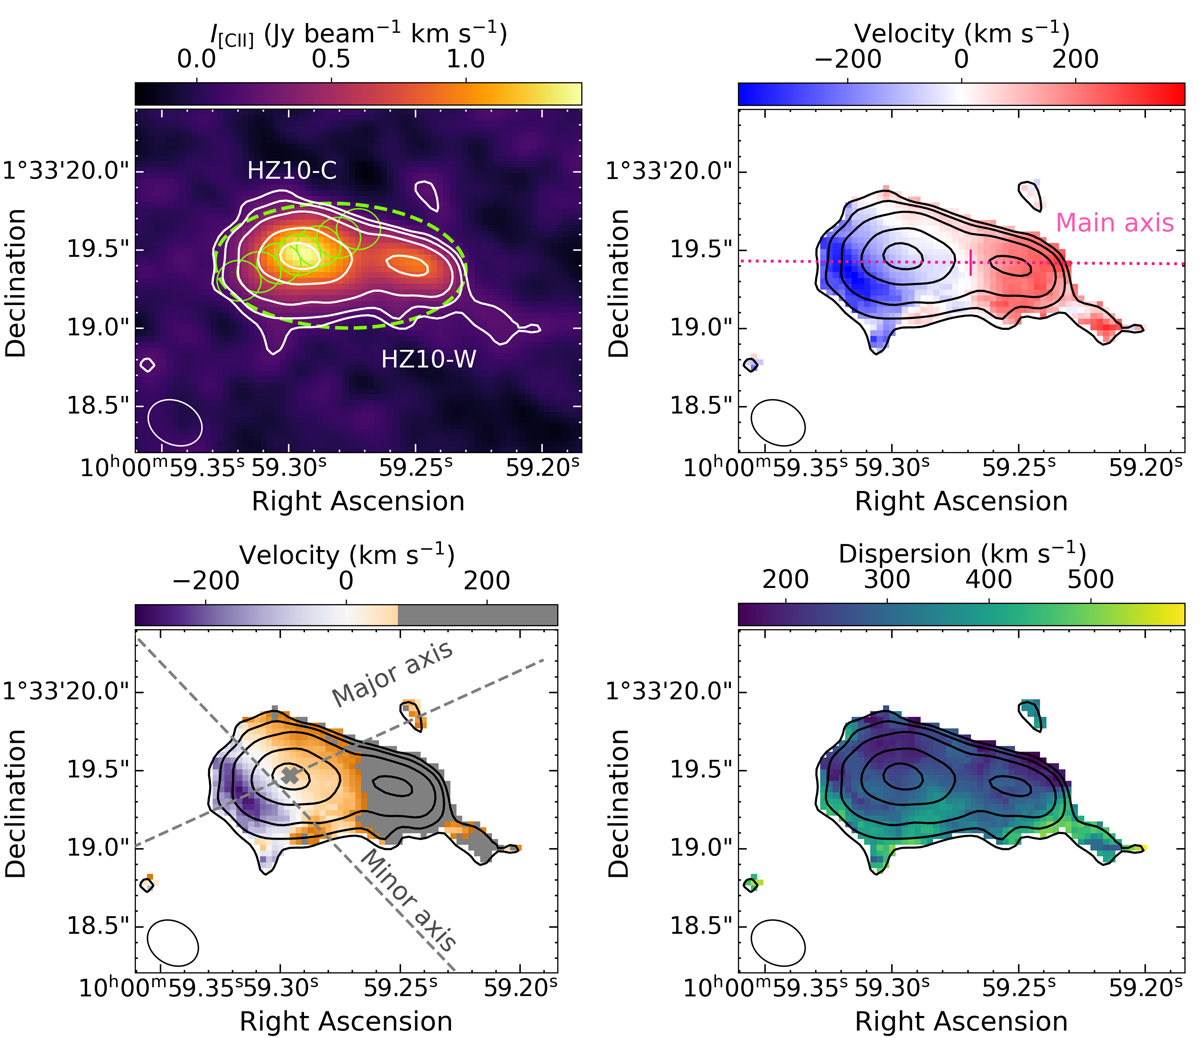
[C II] integrated intensity (moment-0; top left panel), line-of-sight velocity (moment-1; zero velocity is a systemic velocity that corresponds to the rest-frame [C II] frequency at z = 5.6548; top-right panel), adopted line-of-sight velocity (where zero velocity corresponds to the HZ10-C systemic velocity; bottom-left panel), and velocity dispersion (moment-2; bottom-right panel) maps of HZ10. Contours correspond to the 2σ, 3σ, 5σ, 10σ, and 15σ noise levels estimated from the corresponding moment-0 map. The dashed and solid green regions on the moment-0 map correspond to the apertures for the spectra extraction. The dashed gray and dotted pink lines on the moment-1 maps correspond to the axes for the PV diagram calculations. The center of the main and major axes of HZ10 are indicated with the pink vertical line and the gray cross, respectively. An ellipse shows the beam size of the ALMA observations in the bottom-left corner of each panel.
Current usage metrics show cumulative count of Article Views (full-text article views including HTML views, PDF and ePub downloads, according to the available data) and Abstracts Views on Vision4Press platform.
Data correspond to usage on the plateform after 2015. The current usage metrics is available 48-96 hours after online publication and is updated daily on week days.
Initial download of the metrics may take a while.