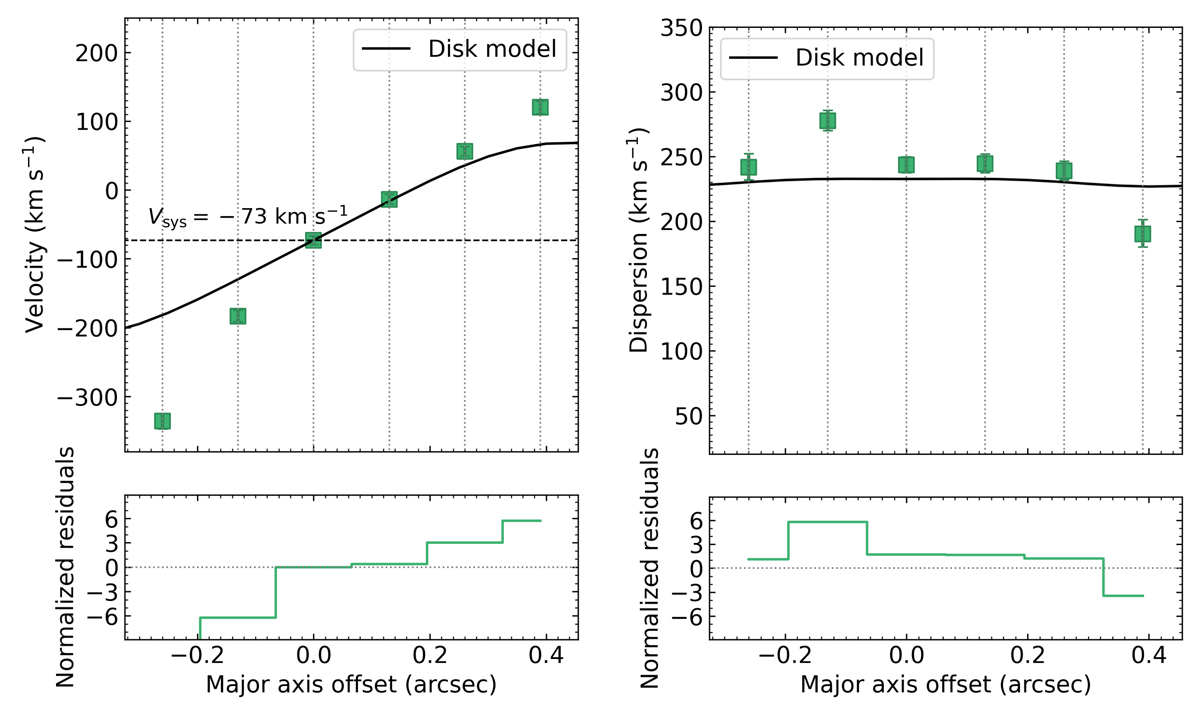
Fig. C.4.
Download original image
Rotation curves calculated for HZ10-C excluding the impact of the HZ10-E component. Data points correspond to the velocity centroids (left panel) and velocity dispersion (right panel) of a single Gaussian fit of the spectra within circular apertures of radius 0.13″ as a function of the relative aperture position. Apertures were placed along the major axis with a step of 0.13″. Zero velocity is calculated for the rest-frame [C II] frequency at z = 5.6548. Zero offset corresponds to the aperture position at the same zero point as for the respective PV diagram. Black curves represent the best-fit disk model done with DysmalPy. Normalized residuals represent the difference between data points and the model, divided by the data uncertainties. Note that we exclude the first aperture (top panel in Fig. B.2) as the emission in that region is dominated by the HZ10-E component.
Current usage metrics show cumulative count of Article Views (full-text article views including HTML views, PDF and ePub downloads, according to the available data) and Abstracts Views on Vision4Press platform.
Data correspond to usage on the plateform after 2015. The current usage metrics is available 48-96 hours after online publication and is updated daily on week days.
Initial download of the metrics may take a while.