Fig. C.3.
Download original image
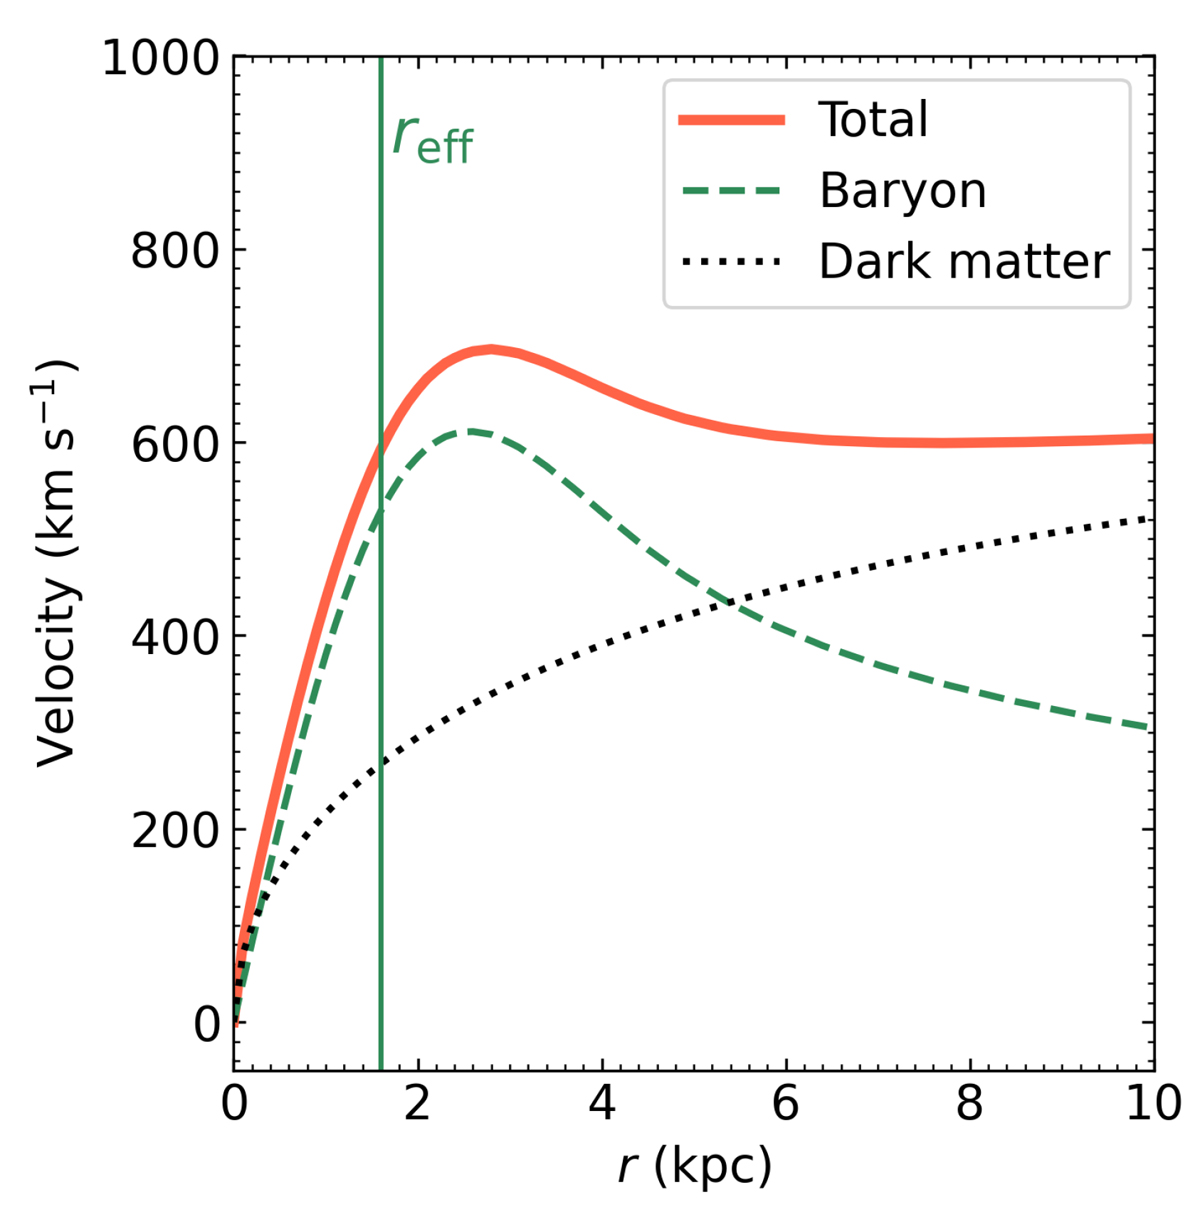
Best-fit results of DysmalPy kinematic modeling of HZ10-C+HZ10-E rotation curves. The solid red curve shows the total intrinsic circular velocity corrected by inclination and beam smearing. The baryon and dark matter components are shown with the dashed green and dotted black curves, respectively. The vertical green line corresponds to the disk’s effective radius.
Current usage metrics show cumulative count of Article Views (full-text article views including HTML views, PDF and ePub downloads, according to the available data) and Abstracts Views on Vision4Press platform.
Data correspond to usage on the plateform after 2015. The current usage metrics is available 48-96 hours after online publication and is updated daily on week days.
Initial download of the metrics may take a while.