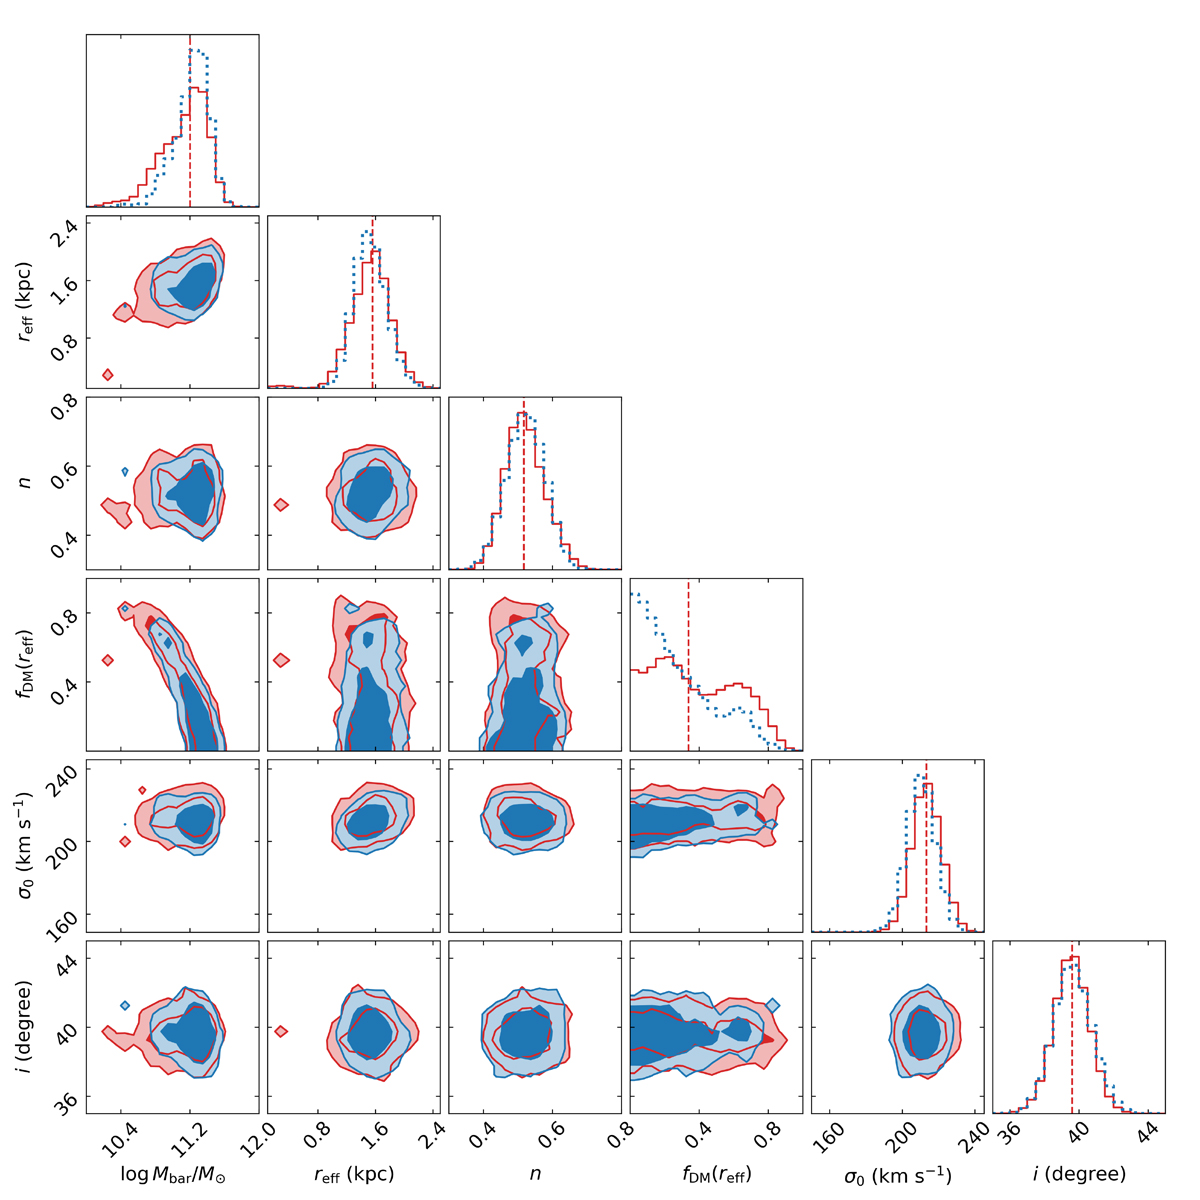
Fig. C.2.
Download original image
Posterior distributions of the estimated parameters for HZ10-E+HZ10-C system. Red and blue correspond to the analyses conducted with overlapping and independent apertures, respectively. Contours correspond to the 68 and 75 percent highest posterior density credible regions, respectively. Vertical dotted lines show 0.5 quantiles of the posterior distributions (overlapping apertures).
Current usage metrics show cumulative count of Article Views (full-text article views including HTML views, PDF and ePub downloads, according to the available data) and Abstracts Views on Vision4Press platform.
Data correspond to usage on the plateform after 2015. The current usage metrics is available 48-96 hours after online publication and is updated daily on week days.
Initial download of the metrics may take a while.