Fig. A.1.
Download original image
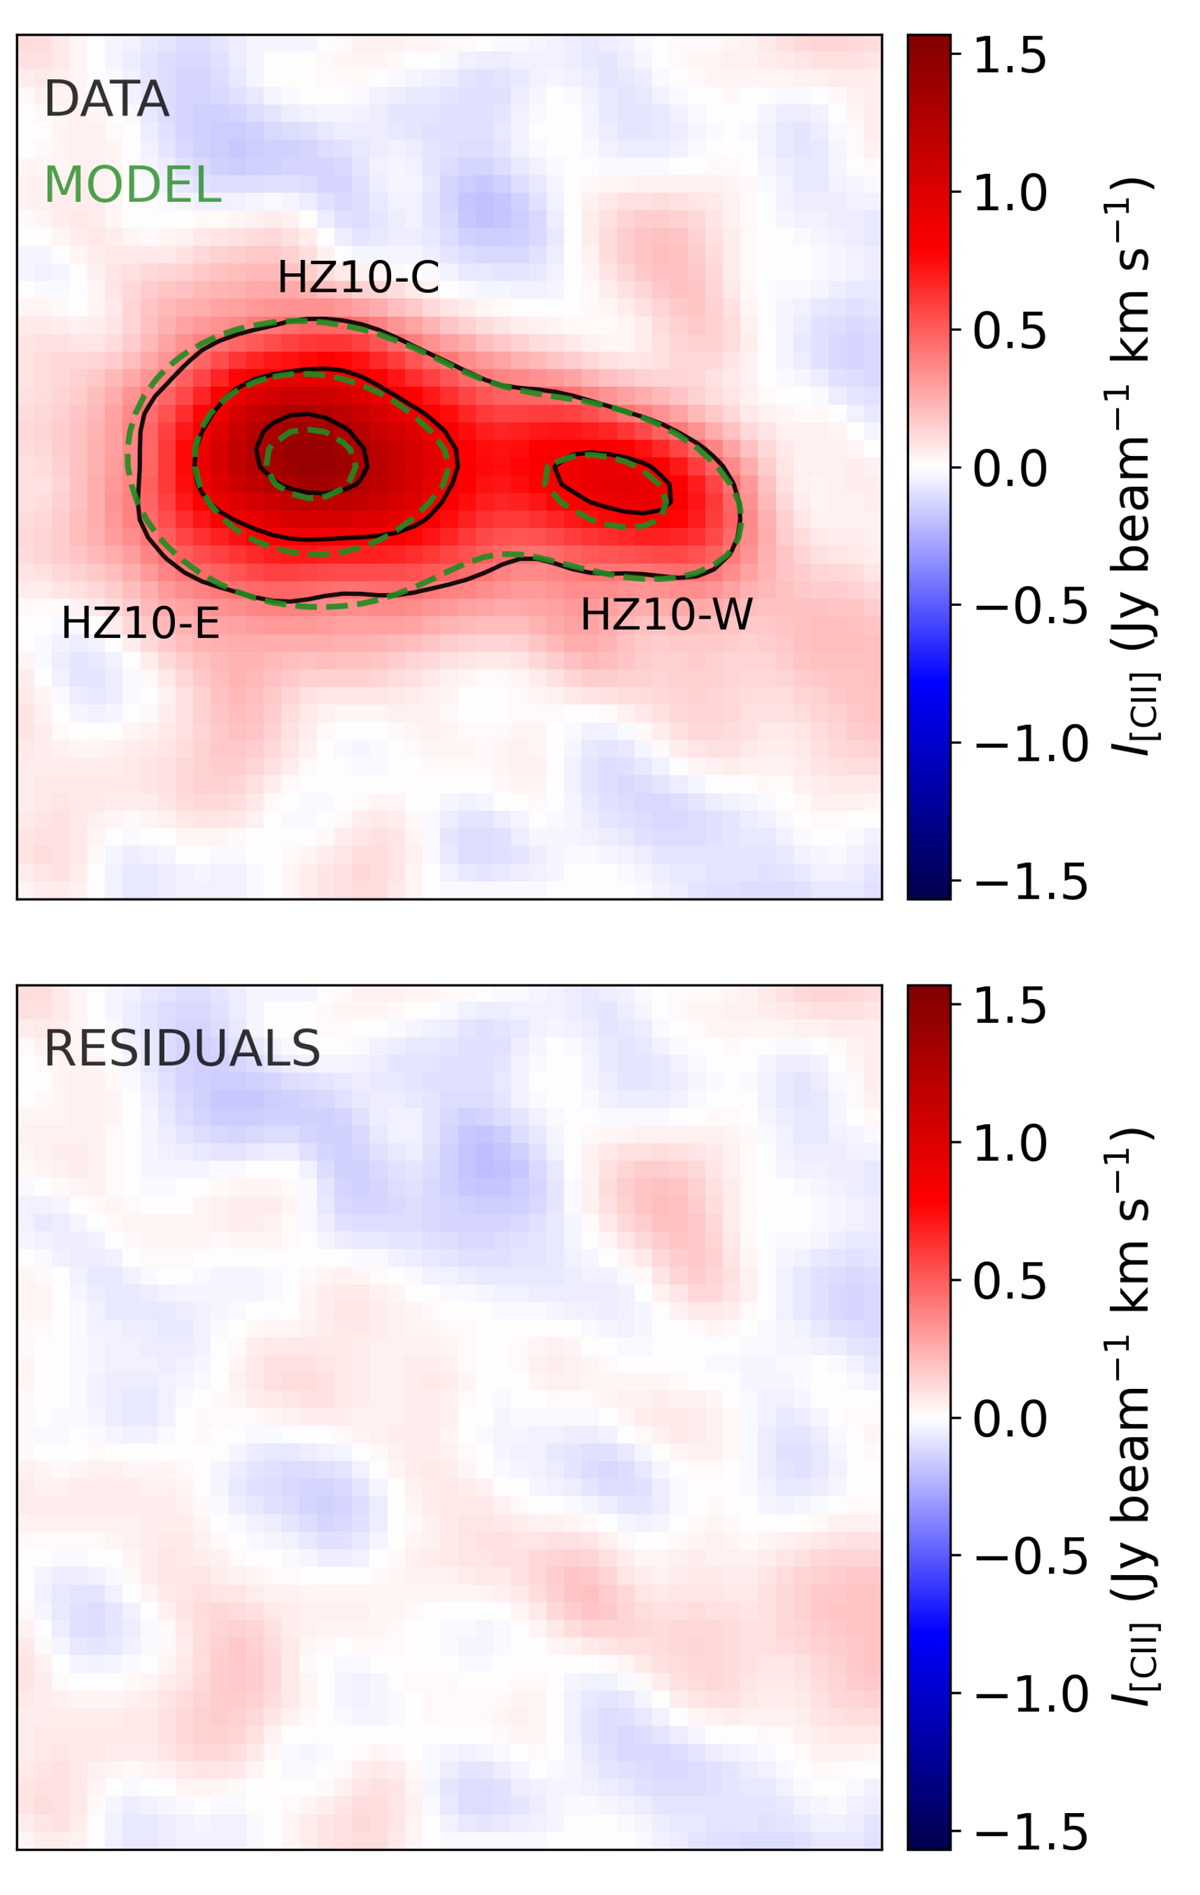
Top: [C II] integrated intensity (color map) and 5σ, 10σ, and 15σ noise levels (black contours). The best-fit two-component 2D Sérsic profile model is shown with dashed green 5σ, 10σ, and 15σ contours (see Table 1 for the parameter details). Bottom: Residuals between the observed intensity map and the best-fit 2D Sérsic profile.
Current usage metrics show cumulative count of Article Views (full-text article views including HTML views, PDF and ePub downloads, according to the available data) and Abstracts Views on Vision4Press platform.
Data correspond to usage on the plateform after 2015. The current usage metrics is available 48-96 hours after online publication and is updated daily on week days.
Initial download of the metrics may take a while.