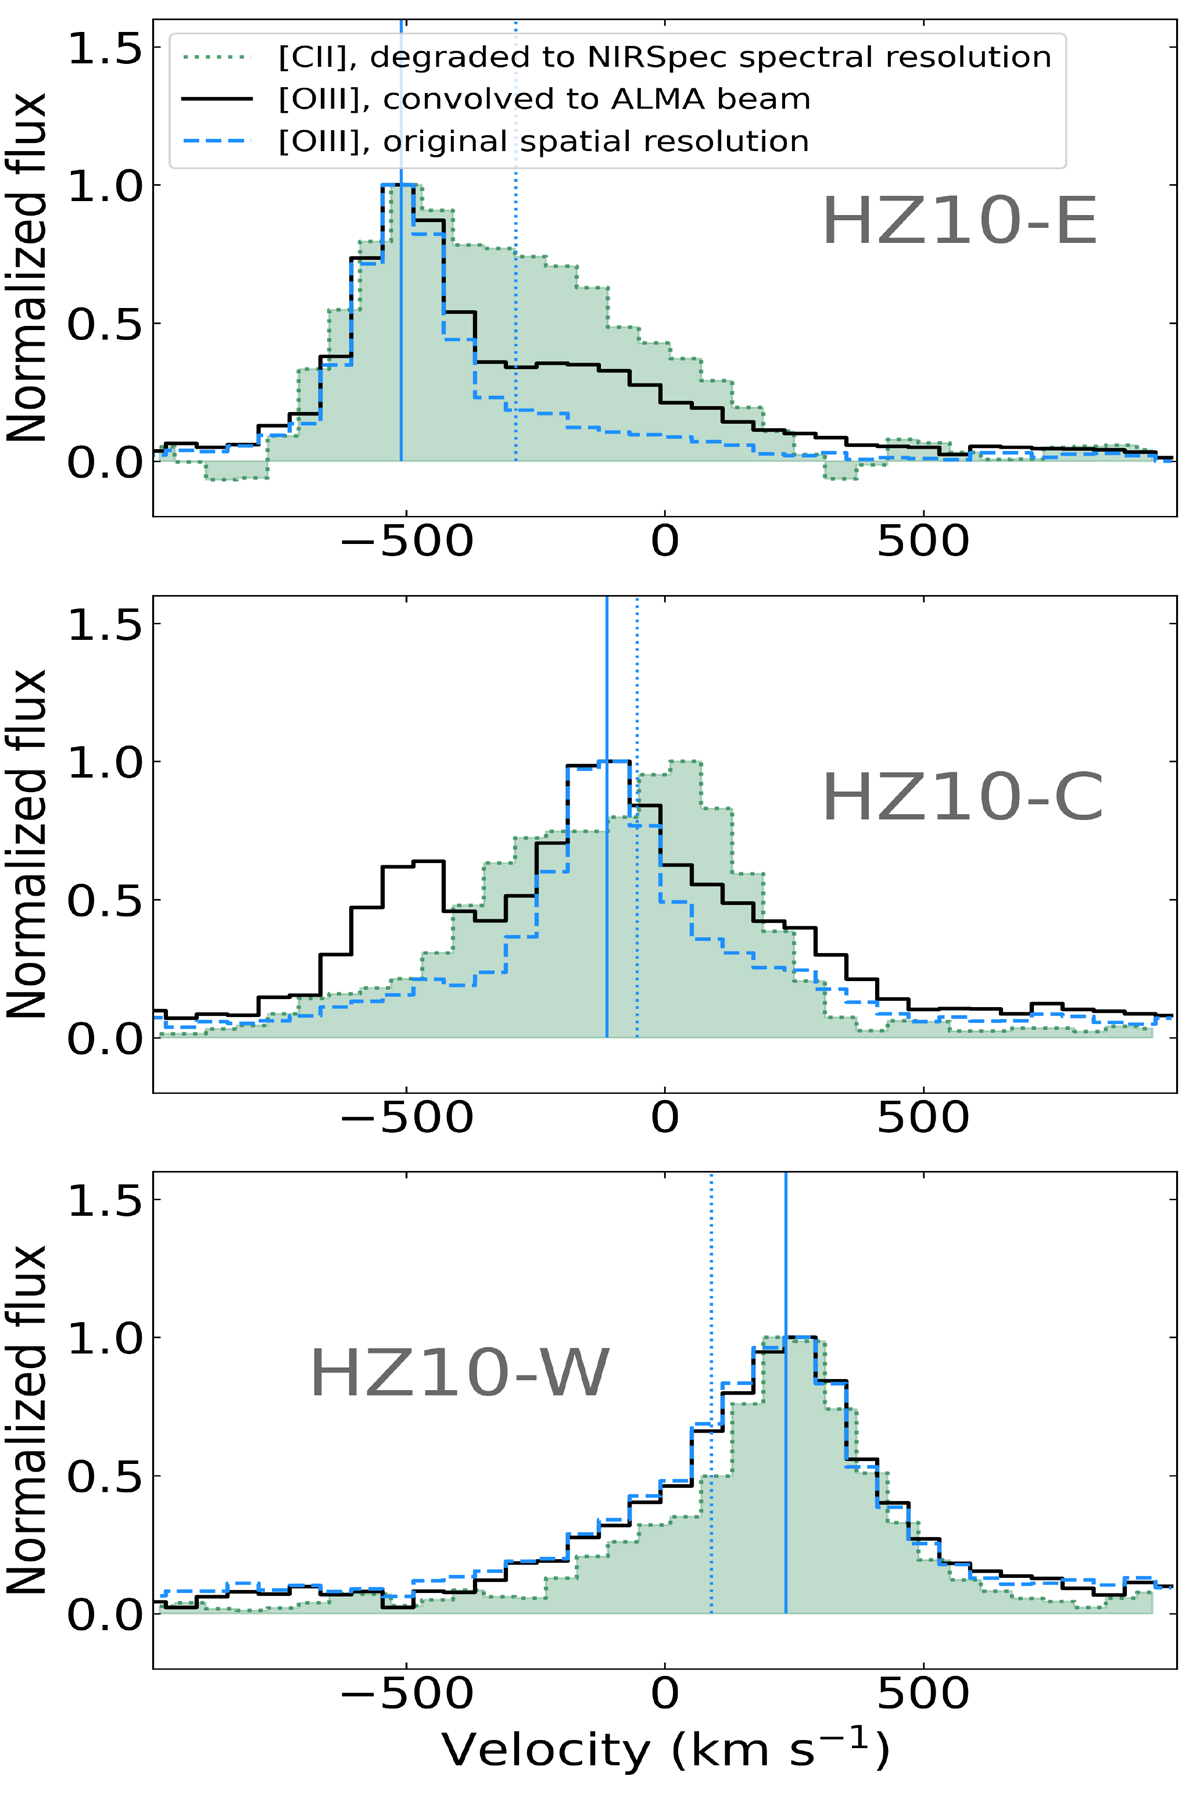
Fig. 10.
Download original image
[O III] 5007Å JWST/NIRSpec (black and dashed blue lines) and [C II] ALMA (green) spectra of the HZ10-E (top), HZ10-C (middle), and HZ10-W (bottom) components. The spectra were extracted from circular apertures that roughly match the beam size and were centered on the spatial positions of the components. For the JWST/NIRSpec spectra, the solid black line shows data from a cube with spatial resolution degraded to match that of ALMA, while the dashed blue line shows data at the original spatial resolution. For the ALMA data, the spectral resolution is degraded to match that of the [O III] data. Zero velocity is calculated at the systemic redshift z = 5.6548. The vertical solid and dotted blue lines indicate the velocity centroids of the narrow and broad rest-frame optical spectral line components, respectively, taken from Jones et al. (2024). Note that we renormalized all spectra to their peak intensity to simplify the kinematic comparison of the profiles; thus, the relative fluxes here are not comparable to the observed ones. However, we compare the observed fluxes in the main text.
Current usage metrics show cumulative count of Article Views (full-text article views including HTML views, PDF and ePub downloads, according to the available data) and Abstracts Views on Vision4Press platform.
Data correspond to usage on the plateform after 2015. The current usage metrics is available 48-96 hours after online publication and is updated daily on week days.
Initial download of the metrics may take a while.