Fig. 9.
Download original image
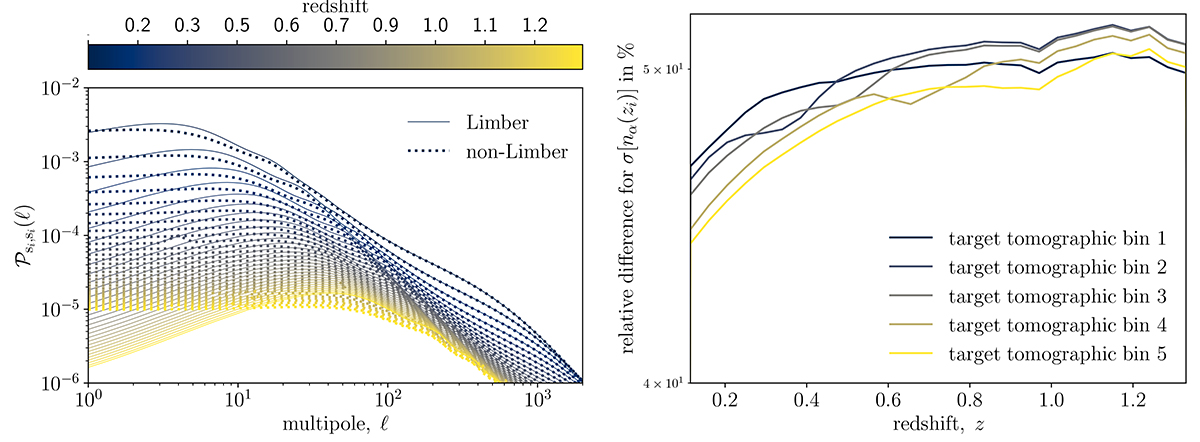
Left: auto-correlation angular power spectra of the reference sample as a function of spectroscopic redshift (colour bar). The solid lines use the Limber approximation, Equation (10), while the dashed lines make use of the full expression, Equation (8). Right: fractional difference as a percentage of the Gaussian covariance term when using Limber vs non-Limber.
Current usage metrics show cumulative count of Article Views (full-text article views including HTML views, PDF and ePub downloads, according to the available data) and Abstracts Views on Vision4Press platform.
Data correspond to usage on the plateform after 2015. The current usage metrics is available 48-96 hours after online publication and is updated daily on week days.
Initial download of the metrics may take a while.