Fig. 8.
Download original image
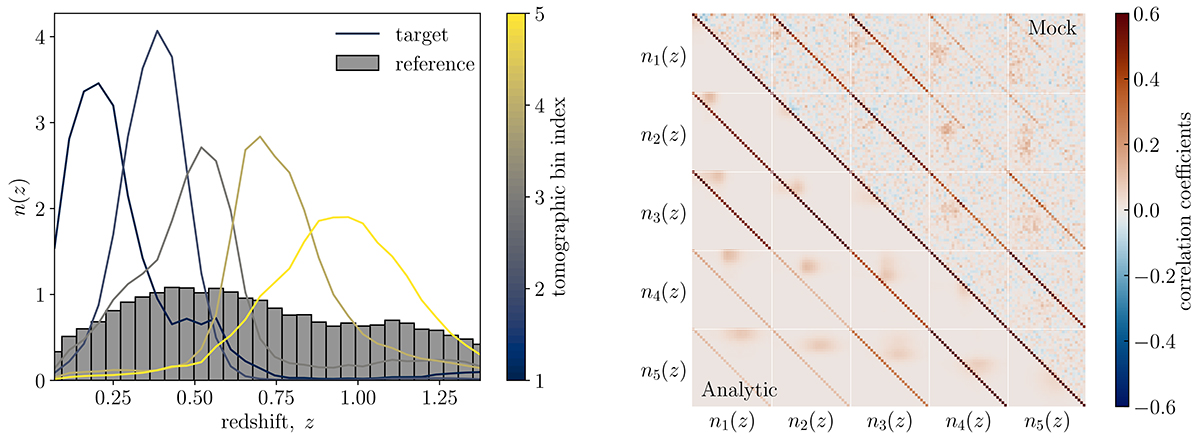
Left: redshift distribution of the target sample for five tomographic bins of KiDS-1000 as solid lines. The grey bars indicate the reference sample. Right: Pearson correlation coefficient with the lower triangle showing the predictions of the analytical prescription, Equation (91), while the upper triangle shows the results obtained by jackknife resampling from Hildebrandt et al. (2021) (compare their Figure 3).
Current usage metrics show cumulative count of Article Views (full-text article views including HTML views, PDF and ePub downloads, according to the available data) and Abstracts Views on Vision4Press platform.
Data correspond to usage on the plateform after 2015. The current usage metrics is available 48-96 hours after online publication and is updated daily on week days.
Initial download of the metrics may take a while.