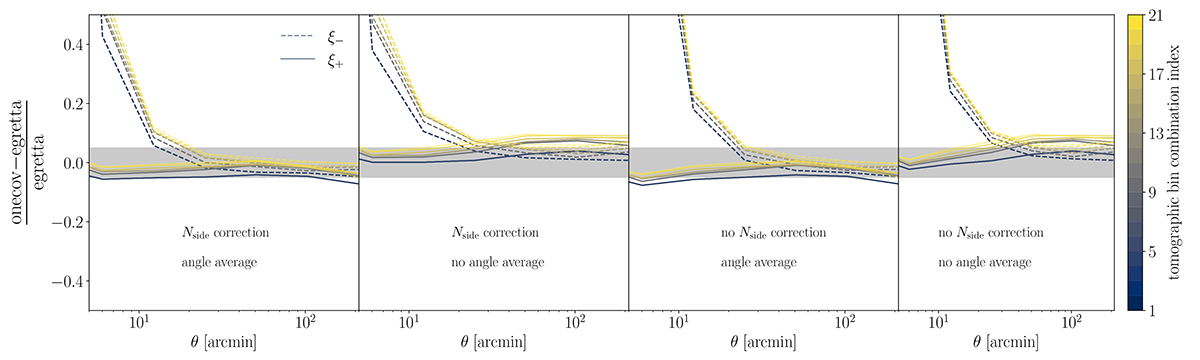
Fig. 4.
Download original image
Relative difference between the signal measured in the 4224 Egretta mocks (realistic mask and depth variations) with the signal prediction of OneCovariance code. The colour bar indicates the different unique tomographic bin combinations, the same as in Figure 3. The dashed lines show ξ− and solid lines ξ+. The grey band indicates a five per cent relative difference. The different plots show varying settings in the OneCovariance code. In particular, we distinguish whether the averaging over the θ bin (see Equation (61)) is carried out and if the pixel window due to the finite resolution of the healpix map is taken into account, i.e. damping power on small scales (Nside correction).
Current usage metrics show cumulative count of Article Views (full-text article views including HTML views, PDF and ePub downloads, according to the available data) and Abstracts Views on Vision4Press platform.
Data correspond to usage on the plateform after 2015. The current usage metrics is available 48-96 hours after online publication and is updated daily on week days.
Initial download of the metrics may take a while.