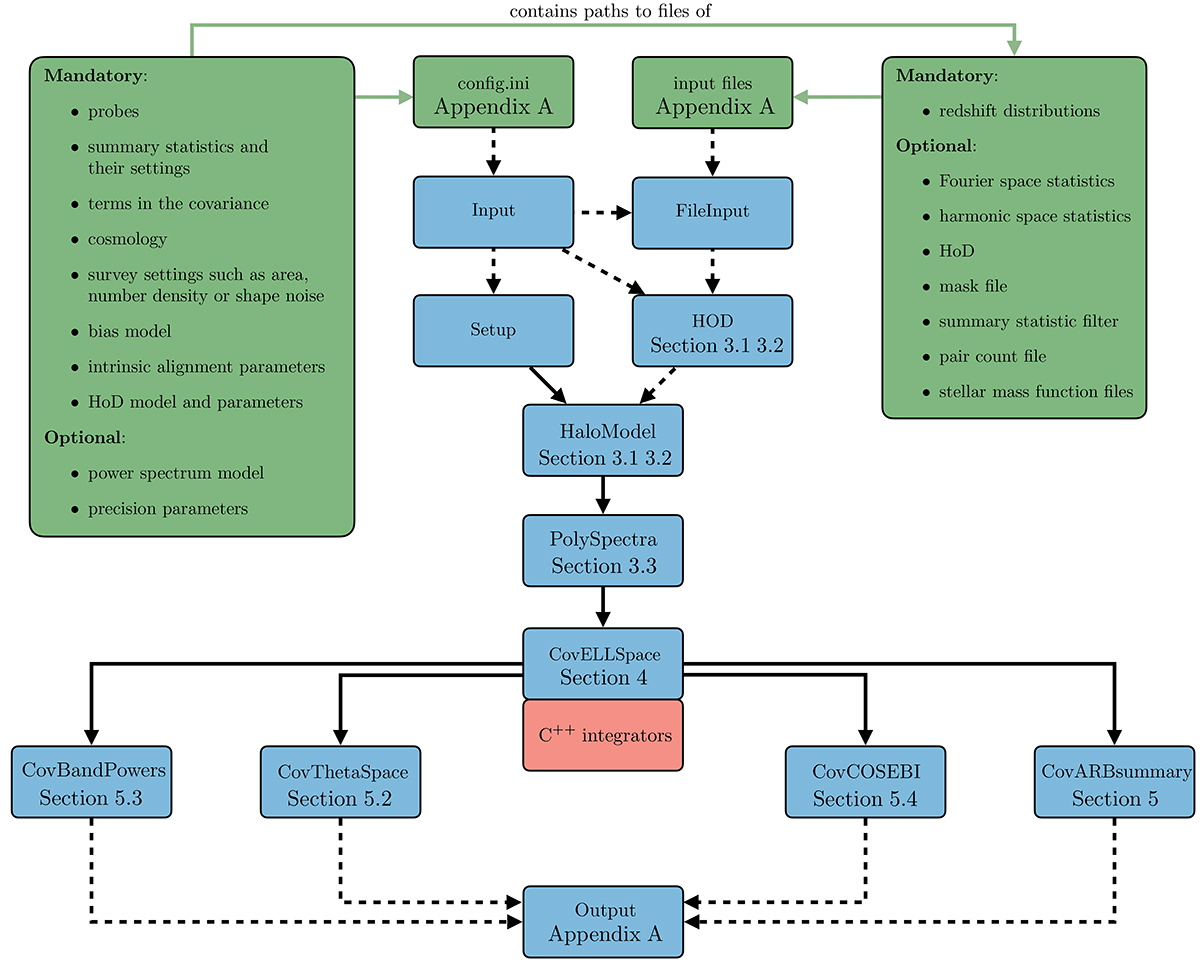
Fig. A.1.
Download original image
General flowchart of the OneCovariance code. The green boxes indicate files that are fed to the code (visit the readthedocs webpage, https://onecovariance.readthedocs.io/en/latest/index.html, for a more detailed discussion). The dashed lines with arrows indicate that files or functionalities are included, but not inherited. The solid arrows instead indicate inheritance. Each blue box indicates a python module in the form of a class with the corresponding name. The red box is a C++ class wrapped into python with pybind to carry out some of the heavy lifting in the code. Section numbers indicate where the corresponding equations and description of the content of each module can be found in the paper.
Current usage metrics show cumulative count of Article Views (full-text article views including HTML views, PDF and ePub downloads, according to the available data) and Abstracts Views on Vision4Press platform.
Data correspond to usage on the plateform after 2015. The current usage metrics is available 48-96 hours after online publication and is updated daily on week days.
Initial download of the metrics may take a while.