Fig. 6.
Download original image
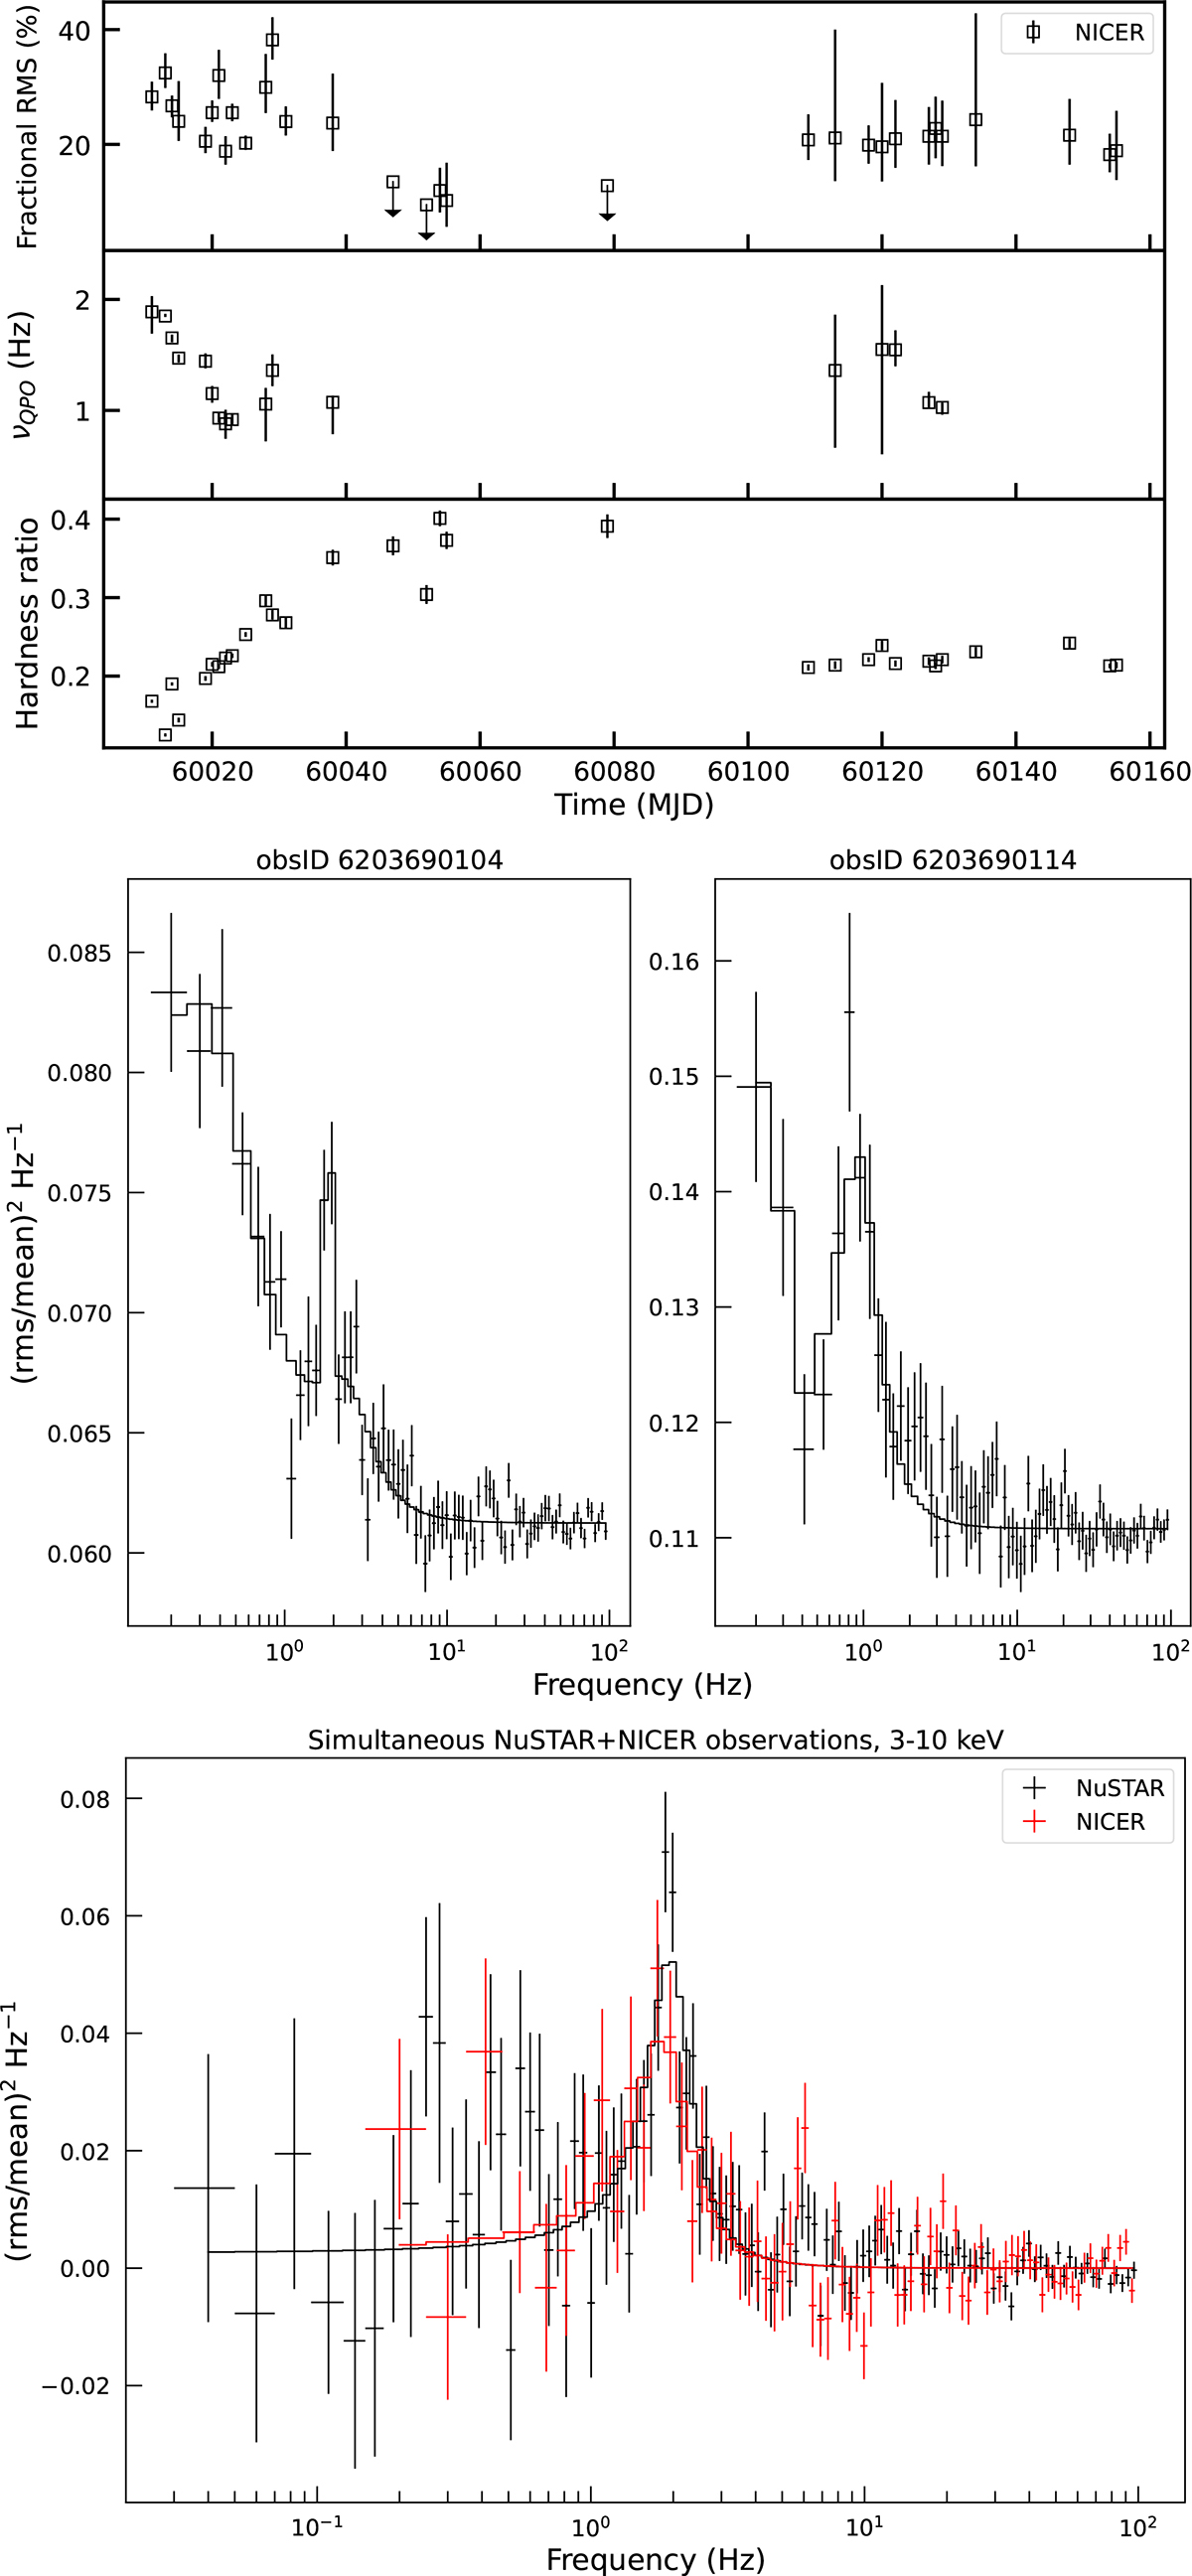
Top: Temporal evolution of the RMS integrated over all frequencies (top panel) and QPO central frequency (medium panel), estimated from the 0.3–12 keV NICERPDS. The bottom panel presents the temporal evolution of the hardness ratio, as defined in Sect. 3.2. Middle: Two 0.3–12 keV NICERPDS showing the QPO for the highest (left, OBSID 6203690104) and lowest (right, OBSID 6203690114) central frequency νQPO. Poisson noise was not subtracted. Bottom: The PDS of the NuSTAR (black) and NICER (red) simultaneous observations in the common energy range of 3–10 keV. Poisson noise was subtracted for plotting purpose. The solid lines represent the best-fit models.
Current usage metrics show cumulative count of Article Views (full-text article views including HTML views, PDF and ePub downloads, according to the available data) and Abstracts Views on Vision4Press platform.
Data correspond to usage on the plateform after 2015. The current usage metrics is available 48-96 hours after online publication and is updated daily on week days.
Initial download of the metrics may take a while.