Fig. 2.
Download original image
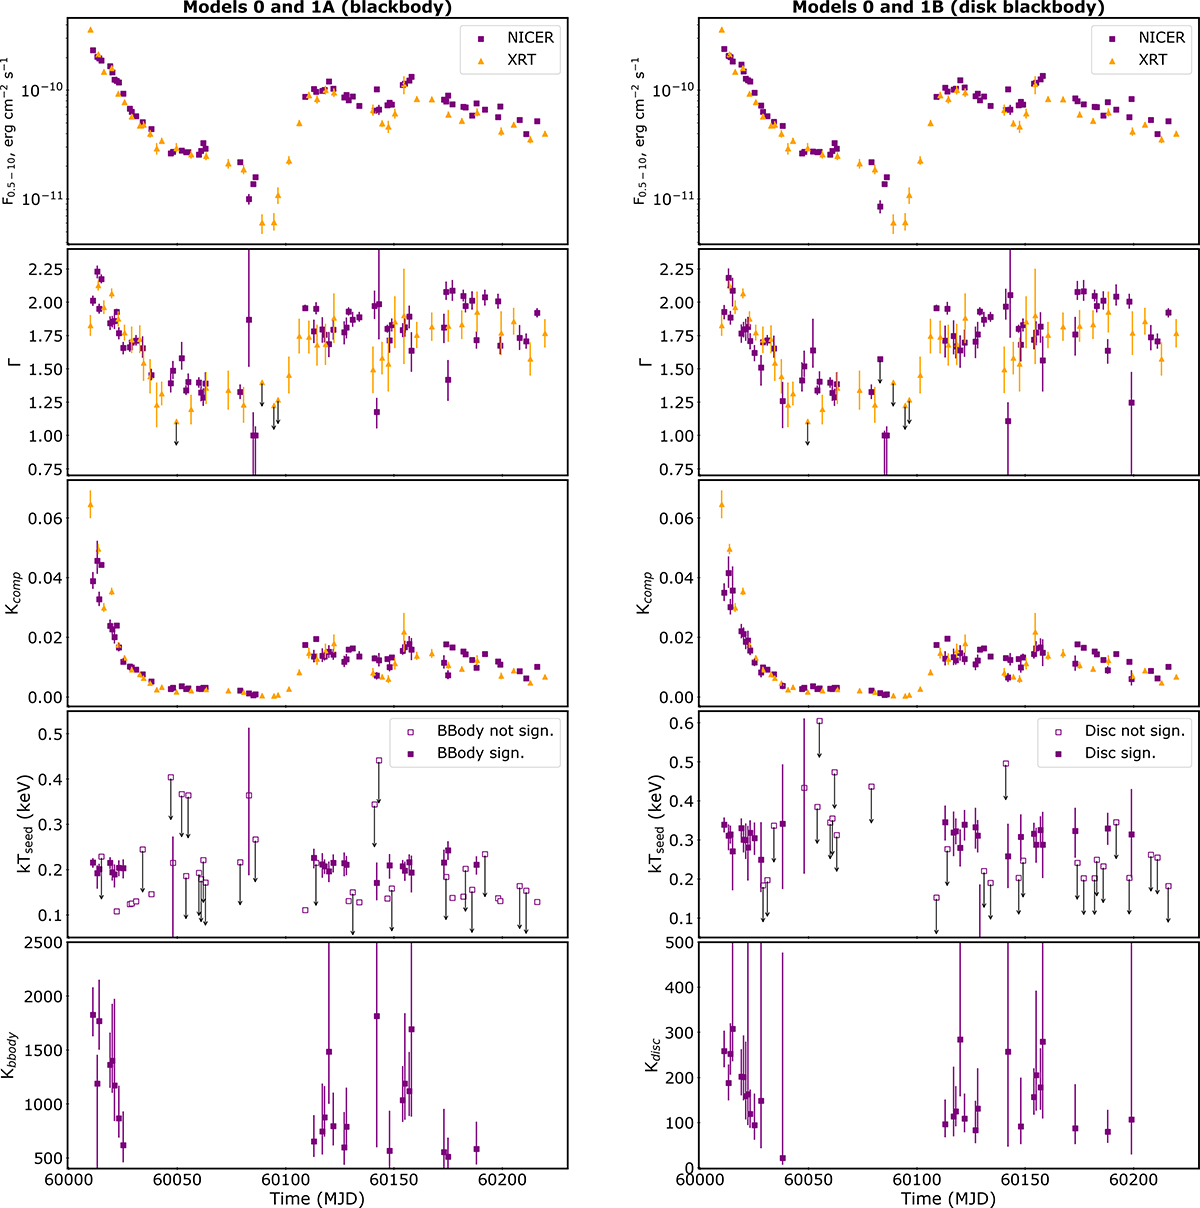
Evolution of the main spectral parameters from the 2023 NICER and Swift campaign on MAXI J1834–021 with Models 0 and 1A (left) and 1B (right). The top panels show the unabsorbed flux in the 0.5–10 keV range as estimated from spectral fitting for both NICER (purple squares) and Swift-XRT (orange triangles). The evolution of the main best-fit parameters used in the spectral analysis (Sect. 3.3.1) is plotted in the other panels. In the fourth panel, filled and empty squares differentiate observations where the inclusion of the bbodyrad/diskbb component is significant (in chich case kTseed=kTbbody or kTseed=kTdisc) from those where it is not significant.
Current usage metrics show cumulative count of Article Views (full-text article views including HTML views, PDF and ePub downloads, according to the available data) and Abstracts Views on Vision4Press platform.
Data correspond to usage on the plateform after 2015. The current usage metrics is available 48-96 hours after online publication and is updated daily on week days.
Initial download of the metrics may take a while.