Open Access
Fig. 7
Download original image
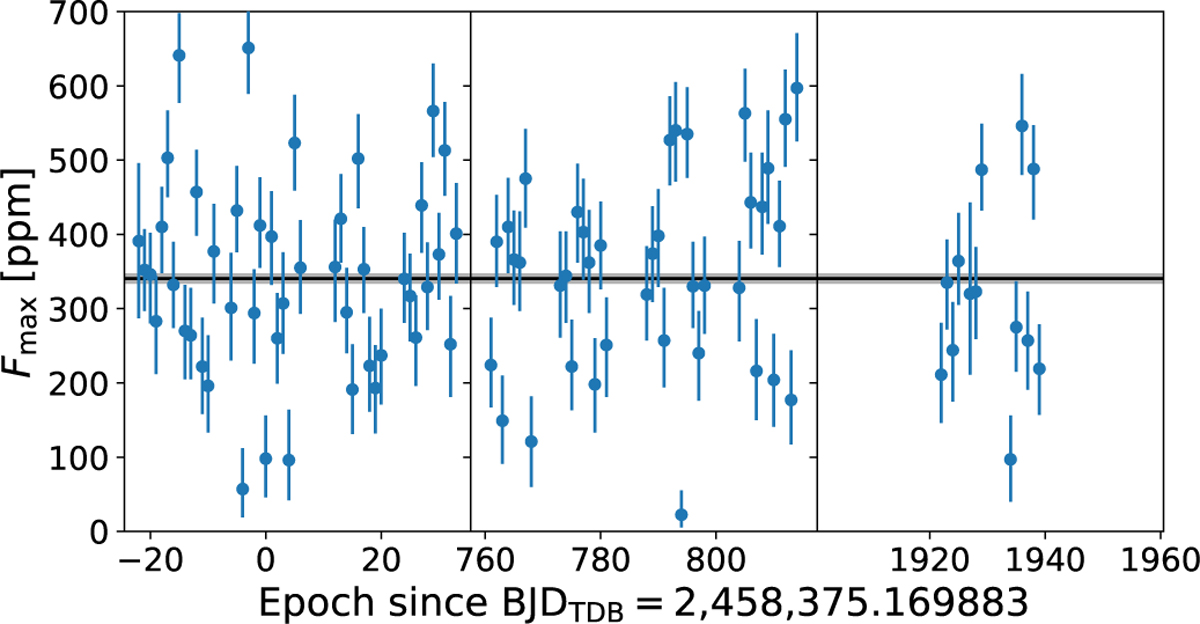
Dayside flux observed in the TESS passband over the 5 sectors: sectors 2 and 3 on the left, sectors 29 and 30 in the center, and sector 69 on the right. The horizontal black line and shaded areas mark the value ![]() from Table 3.
from Table 3.
Current usage metrics show cumulative count of Article Views (full-text article views including HTML views, PDF and ePub downloads, according to the available data) and Abstracts Views on Vision4Press platform.
Data correspond to usage on the plateform after 2015. The current usage metrics is available 48-96 hours after online publication and is updated daily on week days.
Initial download of the metrics may take a while.