Open Access
Fig. 4
Download original image
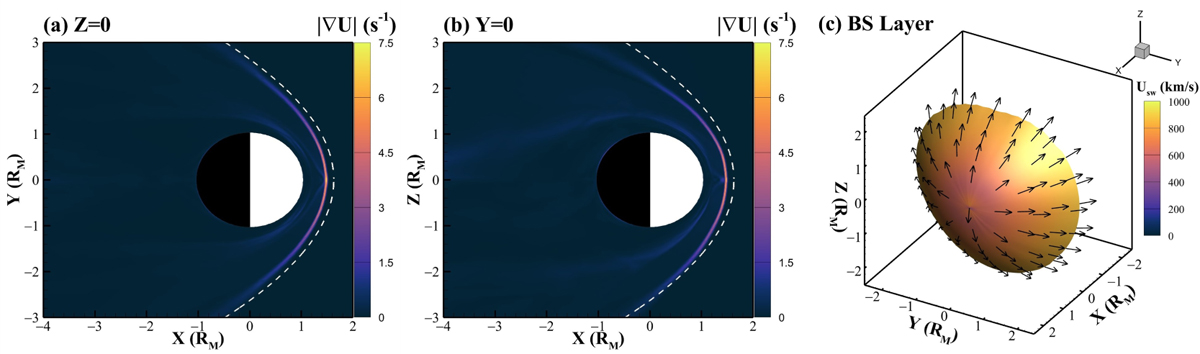
Distribution of radial gradient of solar-wind velocity in (a) XY and (b) XZ planes for Case 2, with dashed lines representing the average bow-shock location (Vignes et al. 2000). (c) Martian bow-shock layer is color-coded based on the magnitude of solar-wind velocity, and it overlaps its vectors for Case 2.
Current usage metrics show cumulative count of Article Views (full-text article views including HTML views, PDF and ePub downloads, according to the available data) and Abstracts Views on Vision4Press platform.
Data correspond to usage on the plateform after 2015. The current usage metrics is available 48-96 hours after online publication and is updated daily on week days.
Initial download of the metrics may take a while.