| Issue |
A&A
Volume 698, June 2025
|
|
|---|---|---|
| Article Number | A250 | |
| Number of page(s) | 8 | |
| Section | Extragalactic astronomy | |
| DOI | https://doi.org/10.1051/0004-6361/202554448 | |
| Published online | 18 June 2025 | |
Shared properties of merger-driven long-duration gamma-ray bursts
1
Department of Astronomy, School of Physics, Peking University, Beijing 100871, China
2
Kavli Institute for Astronomy and Astrophysics, Peking University, Beijing 100871, China
3
Department of Physics, University of Rome “Tor Vergata”, Via della Ricerca Scientifica 1, 00100, Rome, Italy
4
School of Physics and Astronomy, Monash University, Clayton, VIC 3800, Australia
5
OzGrav: The ARC Centre of Excellence for Gravitational Wave Discovery, Australia
6
Nevada Center for Astrophysics, University of Nevada, Las Vegas, NV 89154, USA
7
Department of Physics and Astronomy, University of Nevada, Las Vegas, NV 89154, USA
8
National Astronomical Observatories, Chinese Academy of Sciences, Beijing 100012, China
⋆ Corresponding authors: This email address is being protected from spambots. You need JavaScript enabled to view it.
; This email address is being protected from spambots. You need JavaScript enabled to view it.
Received:
10
March
2025
Accepted:
15
May
2025
Abstract
Context. The recent detections of bright optical/infrared kilonova signals following two long-duration gamma-ray bursts (LGRBs), GRB 211211A and GRB 230307A, have significantly challenged the traditional classification of GRBs. These merger-driven LGRBs may represent a distinct GRB population, sparking interest in their progenitors and central engines.
Aims. Traditional GRB classification methods often struggle to distinguish merger-driven LGRBs from traditional merger-driven short-duration GRBs resulting from compact object mergers and from collapse-driven LGRBs produced by massive stars. We thus aim to explore the shared properties in terms of hardness, energy, and duration among observed merger-driven LGRB events, thereby identifying their observed differences from the traditional GRB population.
Methods. We collected a sample of merger-driven LGRBs with known redshifts, including observed information on their main emission (ME) and whole emission (WE) phases. Treating ME and WE properties as two independent sets of information, we applied several GRB classification methodologies to explore their potential shared properties.
Results. Using the phenomenologically defined energy-hardness (EH) parameter, characterized by the intrinsic hardness and energy of GRBs, and the duration of GRBs, we identified a probable universal linear correlation across merger-driven LGRBs that holds regardless of whether their ME or WE phases are considered.
Conclusions. We propose that such shared properties of merger-driven LGRBs are unlikely to arise from the low-redshift selection effect, and they become particularly intriguing when compared with the relatively weak correlations or lack of correlation observed in traditional merger-driven short-duration GRBs (with or without extended emissions) and collapse-driven LGRBs. Our newly proposed correlation highlights the necessity for further investigation into the observations of merger-driven LGRBs and the physical mechanisms underlying the empirical correlation.
Key words: gamma-ray burst: general / gamma rays: general
© The Authors 2025
 Open Access article, published by EDP Sciences, under the terms of the Creative Commons Attribution License (https://creativecommons.org/licenses/by/4.0), which permits unrestricted use, distribution, and reproduction in any medium, provided the original work is properly cited.
This article is published in open access under the Subscribe to Open model. This email address is being protected from spambots. You need JavaScript enabled to view it. to support open access publication.
1. Introduction
Gamma-ray bursts (GRBs) are the most luminous explosions in the Universe, characterized by the emission of one or multiple γ-rays flashes. Statistical analyses of their durations have revealed a bimodal distribution with a separation at ∼2 s, indicating the existence of two distinct progenitor classes (Kouveliotou et al. 1993)1. Long-duration GRBs (LGRBs), with durations ≳2 s, are generally attributed to the core-collapse of massive stars (Woosley 1993; Paczynski 1998; Woosley et al. 1999; MacFadyen & Woosley 1999); this classification is supported by their associations with broad-lined Type Ic supernovae (SNe; Galama et al. 1998; Woosley & Bloom 2006). Short-duration GRBs (SGRBs), lasting ≲2 s, are widely believed to originate from mergers of compact binary systems, such as neutron star–neutron star (NS–NS) and black hole–neutron star (BH-NS) systems (Paczynski 1986, 1991; Eichler et al. 1989; Narayan et al. 1992). The landmark gravitational-wave event GW170817 (Abbott et al. 2017b), accompanied by electromagnetic counterparts GRB 170817A (Abbott et al. 2017a; Goldstein et al. 2017; Savchenko et al. 2017; Zhang et al. 2018) and AT 2017gfo (Coulter et al. 2017; Evans et al. 2017; Pian et al. 2017; Kilpatrick et al. 2017; Troja et al. 2017), provided smoking-gun evidence of SGRBs and kilonovae (KNe) originating from NS–NS mergers (Li & Paczynski 1998; Metzger et al. 2010). This milestone co-detection marked a breakthrough in multi-messenger astrophysics and is widely regarded as a watershed moment in both astronomy and physics. The connection between gravitational-wave BH–NS mergers and SGRBs remains to be confirmed, since the gravitational-wave BH–NS events observed so far are possibly plunging events (e.g., Abbott et al. 2021; Zhu et al. 2021, 2024; Abac et al. 2024).
However, using duration alone for GRB classification can sometimes introduce ambiguity. For example, a notable subset of GRBs exhibits a short-hard main emission (ME) phase, similar to normal merger-origin SGRBs, but it is followed by an extended emission (EE) component that lasts for tens of seconds and features a softer energy spectrum; this along with their overall properties could lead to them being wrongly identified as collapse-driven LGRBs (Lazzati et al. 2001; Connaughton 2002; Montanari et al. 2005; Norris & Bonnell 2006; Norris et al. 2010; Gao et al. 2017). Additionally, the detection of optical/infrared KN signals following certain LGRBs with ME durations longer than 2 s challenges traditional GRB classifications, notably in GRB 060614 (Gehrels et al. 2006; Della Valle et al. 2006; Gal-Yam et al. 2006; Zhang et al. 2007; Yang et al. 2015; Jin et al. 2015), GRB 211211A (Rastinejad et al. 2022; Yang et al. 2022; Troja et al. 2022; Zhang et al. 2022), and GRB 230307A (Levan et al. 2024; Sun et al. 2025; Yang et al. 2024). These observations suggest that a group of LGRBs should have merger origins. Intriguingly, such long durations are unexpected for merger events, as the accretion timescales required for jet-launching are generally thought to be relatively short (Narayan et al. 1992). Consequently, merger-driven LGRBs may represent a distinct GRB population, sparking interest in models in which the progenitors and central engines of such events are unassociated with the core-collapse of massive stars (Gao et al. 2022; Zhu et al. 2022; Gompertz et al. 2023; Zhong et al. 2023, 2024a; Dichiara et al. 2023; Gottlieb et al. 2023, 2025; Wang et al. 2024; Du et al. 2024; Peng et al. 2024a; Chen et al. 2024; Meng et al. 2024; Zhang 2025).
Since commonly used GRB classification methods often struggle to distinguish merger-driven LGRBs from traditional merger-driven SGRBs and collapse-driven LGRBs, this work aims to investigate the shared properties in terms of hardness, energy, and duration among currently observed merger-driven LGRBs, as well as to identify how they differ from traditional GRBs. We first present the construction of GRB samples in Sect. 2. In Sect. 3 we report our results and detailed analyses of different classification methods for merger-driven LGRBs, which is followed by a detailed discussion of our newly proposed relations in Sect. 4. Finally, Sect. 5 concludes the paper. We adopt a standard Λ cold dark matter model with Ωm = 0.315, ΩΛ = 0.685, and H0 = 67.4 km s−1 Mpc−1 (Aghanim et al. 2020).
2. GRB sample
As mentioned above, the traditional SGRB versus LGRB classification does not always accurately reflect the true physical origin of GRBs. By analogy with SN classifications, Zhang et al. (2007, 2009) proposed that GRBs originating from compact binary mergers and core-collapses of massive stars can be named as Type I GRBs and Type II GRBs, respectively, hereafter GRB-Is and GRB-IIs. In this paper, we further classify merger-driven LGRBs (LGRB-Is) as a distinct subgroup within the GRB-I population, particularly in contrast to traditional merger-driven GRBs with relatively short ME durations (SGRB-Is). In Sect. 2.1 we briefly introduce the known SGRB-I and GRB-II samples adopted in this work. Additionally, we describe how we constructed the sample of LGRB-Is in Sect. 2.2.
2.1. SGRB-I and GRB-II samples
We adopted a sample of 42 SGRB-Is and 273 GRB-IIs with known redshifts from Minaev & Pozanenko (2020), which we denote as the “MP sample” hereafter. Accordingly, all references to “SGRB-I” in this work should be interpreted as SGRB-I within the MP sample. Collected from 6 experiments in total (Konus-Wind, BeppoSAX, BATSE/CGRO, HETE-2, Swift, and Fermi), the MP sample includes GRB events observed up to January 2019. The MP sample includes 40 GRB-IIs associated with Type Ic SNe, comprising 19 photometrically confirmed Type Ic SNe and 21 spectroscopically confirmed ones. The most distant SGRB-I event is GRB 111117A with a redshift of z≃2.2112, while the most distant GRB-II event is GRB 090423 with a redshift of z≃8.23 (Salvaterra et al. 2009; Tanvir et al. 2009). Further details regarding this sample and its observed properties can be found in Minaev & Pozanenko (2020).
Building on the intrinsic hardness-total energy correlations (Amati et al. 2002), Minaev & Pozanenko (2020) further introduced a new classification indicator for SGRB-Is and GRB-IIs, termed the energy-hardness (EH) parameter, defined as
 (1)
(1)
where Ep,i=Ep(1+z) represents the intrinsic (rest-frame) peak energy of a GRB event, with Ep denoting the position of the extremum (maximum) of the observed time-integrated energy spectrum νFν, and Eγ,iso is the isotropic equivalent total energy. Furthermore, Minaev & Pozanenko (2020) refined the EH parameter by incorporating the intrinsic duration, i.e., T90,i=T90/(1+z), where T90 is often defined as the time interval during which the integrated photon counts increase from 5% to 95% (Kouveliotou et al. 1993)3 This leads to a second classification parameter called energy-hardness-duration (EHD), defined as
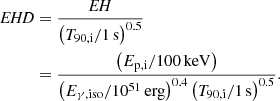 (2)
(2)
Minaev & Pozanenko (2020) suggested that EH = 3.3 can be employed for a blind classification of GRB events, and EHD = 2.6 demonstrates superior performance.
2.2. LGRB-I sample
GRB 060614 and the more recently detected GRB 211211A and GRB 230307A, which all have known redshifts, are believed to be LGRB-I events associated with detected KN signals (Yang et al. 2015, 2024; Jin et al. 2015; Troja et al. 2022; Levan et al. 2024; Kasen 2024; Wang et al. 2025). We collected their observed data and derived properties from the previous studies (see Table A.1.). Additionally, we included two more nearby LGRBs with known redshift z≲0.3 but without expected SN observations: GRB 060505 (Fynbo et al. 2006; Ofek et al. 2007; Thone et al. 2008) and GRB 211227A (Lü et al. 2022; Ferro et al. 2023)4 which are expected to have merger origins. Notably, except for GRB 060505, the other LGRB-I events exhibit an EE component following the hard, long-duration ME phase5. Given that the EE component may remain undetected in some GRB events, the ME phase can be treated as the whole emission (WE) phase in such cases. Thus, following Zhu et al. (2022), we considered ME and WE properties as two independent sets of information for our LGRB-I sample. This treatment serves as a heuristic attempt to explore potential shared properties among LGRB-I events in subsequent analyses.
3. Empirical relations for LGRB-Is
We analyze several GRB classification methodologies in this section, with a more detailed discussion of our newly proposed relation for LGRB-Is in Sect. 4.
3.1. Ep,i−Eγ,iso relation
We begin by presenting the Ep,i−Eγ,iso relations for SGRB-I and GRB-II populations, along with our LGRB-I sample, in Fig. 1. It clearly shows that LGRB-Is exhibit a broad range of Eγ,iso values spanning several magnitudes, regardless of whether the ME or WE components are considered. Notably, the Ep,i values of the ME components for each LGRB-I event are generally higher than those of the corresponding WE components. From the overall distribution of LGRB-I events, focusing solely on the ME phase suggests a resemblance to SGRB-Is; however, the classification becomes significantly more challenging when WE phases are considered. In other words, Fig. 1 suggests that no single linear correlation can simultaneously account for both the ME and WE components across all LGRB-I events in the Ep,i−Eγ,iso diagram.
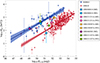 |
Fig. 1. Ep,i−Eγ,iso relations for GRBs with known redshifts. All error bars correspond to 1σ confidence intervals. The solid lines and shaded areas represent the best-fit correlations and the 90% credible intervals, respectively, for SGRB-Is (blue) and GRB-IIs (red). Solid squares and diamonds represent the properties of ME and WE phases for our LGRB-I sample, respectively. |
3.2. Ep−T90 relation
Next, we examined the Ep−T90 domain, as shown in Fig. 2, which is also widely used for GRB classification in the literature (Shahmoradi & Nemiroff 2015; Gruber et al. 2014; von Kienlin et al. 2020; Zhu et al. 2022; Zhu & Tam 2024). By excluding the LGRB-I sample, the Ep−T90 distribution is characterized using two independent two-dimensional Gaussian components, with the histograms of each parameter and their corresponding fits projected onto the top and right panels. The blue and red lines represent the contributions from SGRB-I candidates (smaller T90, larger Ep) and GRB-II candidates (larger T90, smaller Ep), while the black solid lines are the combined distributions of two Gaussian components. The probability of a GRB event being classified as an SGRB-I (PSGRB−I) is calculated by evaluating the GRB's T90 and Ep values under such a two-component Gaussian mixture model. Specifically, we computed the joint likelihoods for the SGRB-I and GRB-II components, and defined PSGRB−I as the normalized probability associated with the SGRB-I component. The resulting PSGRB−I is then represented visually through the color scale in Fig. 2.
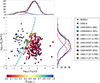 |
Fig. 2. GRB classification diagram in the Ep−T90 domain. The crosses and circles represent the known classification of SGRB-Is and GRB-IIs in the MP sample. The different colors indicate the probability of a GRB event being a SGRB-I (PSGRB−I) based on two independent two-dimensional Gaussian components. The dashed cyan line indicates the dividing line with PSGRB−I = 0.5. In the top and right projected histograms, the blue and red lines represent the contributions from SGRB-I candidates (smaller T90, larger Ep) and GRB-II candidates (larger T90, smaller Ep), while the black lines are the combined distributions of two Gaussian components. |
As illustrated in Fig. 2, most SGRB-Is and GRB-IIs are accurately classified, with PSGRB−I approaching 1 and 0, respectively. Based on these Gaussian distributions, we further plot the boundary where PSGRB−I = 0.5 and find that all ME components of LGRB-Is lie near this boundary, indicating the challenge of definitively classifying them as either SGRB-I or GRB-II events. When the WE phases are considered, the distribution of these LGRB-Is deviates significantly from this boundary, showing no universal correlation across both the ME and WE components, similar to that observed in the Ep,i−Eγ,iso domain in Fig. 1.
3.3. EH−T90,i relation
In the EH−T90,i domain (Fig. 3), we find that all LGRB-Is, regardless of whether their ME or WE components are considered, probably show a universal correlation in log-log space that remains unexplored. Their distribution appears to occupy a distinct parameter space, serving as a “bridge” between the traditional SGRB-I and GRB-II populations. Notably, we do not identify similar correlations within the traditional SGRB-Is and GRB-IIs.
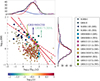 |
Fig. 3. GRB classification diagram in the EH−T90,i domain. The colorbar now indicates the redshift. The ME and WE components of SGRB-I-EE events are denoted by the left- and right-pointing triangles, respectively. The best-fit EH−T90,i correlation is shown as a solid line, with the 90% credible intervals indicated by dashed lines. GRB 980425B (EH = 8.72) and GRB 171205A (EH = 5.78) are labeled. |
Similar to most LGRB-Is, which are typically identified by an EE phase following the ME phase, we note that an EE component is also observed in some SGRB-I events. Given the similar partially observed properties and the same merger origins between LGRB-Is and SGRB-Is with EE components (SGRB-I-EEs), we explored and discuss their EH−T90,i correlations. In the MP sample, the Ep,i (Ep), Eγ,iso, and T90,i (T90) values for these SGRB-I-EE events are derived exclusively from their ME phases. We thus collected the WE properties of SGRB-I-EE events from the literature (see Table A.2.). We first calculated the Pearson correlation coefficient (rP) for LGRB-I events in log10(EH)−log10(T90,i) space, finding rP=−0.95. When additionally including both the ME and EE components of SGRB-I-EE events, we find that the coefficient changes to rP=−0.72. This suggests that the distribution between log10(EH) and log10(T90,i) for the SGRB-I-EE population exhibits more dispersion and a weaker correlation than the LGRB-I population, which in turn motivated us to explore the probable universal linear correlation between log10(EH) and log10(T90,i) in our LGRB-I sample.
We then considered that the universal EH−T90,i correlation among LGRB-Is can be described by a linear model in log-log space, expressed as
 (3)
(3)
where K and B represent the power-law index and the constant factor, respectively. By fitting the properties of our LGRB-I events6 listed in Table A.1., we obtain the final results of  , and
, and  . By incorporating the derived EH−T90,i relation with the EH definition in Eq. (1), we could further derive a power-law empirical correlation among Ep,i, Eγ,iso, and T90,i for LGRB-I events,
 (4)
(4)
Despite the limited sample size of the collected LGRB-Is, these findings provide valuable insights and motivate further investigation. Although the median value of EH for GRB 060614 shows a slight deviation from our proposed universal correlation, we note that it also carries relatively large uncertainties, with its upper limit still falling within the 90% range of the proposed correlation. As more LGRB-I events are observed in the future, these correlations are expected to undergo more rigorous testing, enabling a more comprehensive assessment of their physical significance.
4. Discussion
In addition to the universal linear correlation shown in Fig. 3, the overall distribution of the LGRB-I population in the EH−T90,i domain is located above that of the GRB-II population7, due to the generally larger EH values of LGRB-Is compared to most GRB-II events. Given that all LGRB-Is analyzed in this study are relatively nearby events with redshifts of z≲0.3, we checked whether our newly proposed correlation could result from the low-z selection effect. This concern arises since GRB-IIs with lower Eγ,iso and some low-luminosity GRB-IIs are more easily detected at low redshifts, potentially leading to higher EH values compared to high-z GRBs with similar durations and hardness. For example, as illustrated in Fig. 3, some low-z, low-luminosity GRB-IIs associated with spectroscopically confirmed SNe, such as GRB 980425B and GRB 171205A, lie above the bulk of the GRB-II population. These two events, characterized by Eγ,iso≲1049 erg, have higher EH values than most GRB-IIs, further complicating their classification based solely on EH or EHD values.
However, as discussed in Sect. 3.1, the Eγ,iso values of LGRB-Is exhibit a broad range distribution, regardless of whether the ME or WE components are considered, indicating that our new relation for LGRB-Is cannot be solely attributed to the low-z selection effect. Notably, GRB 211211A and GRB 230307A are not among the faintest bursts, even when compared to the GRB-IIs population. Moreover, Fig. 3 does not suggest that GRB-IIs further below the best-fit line necessarily correspond to higher redshifts. Some GRB-IIs that deviate significantly from our correlations are located at low redshifts, further undermining a simple relationship between deviation and redshift. We therefore propose that our relations are likely intrinsic, driven by relatively large Ep,i values of LGRB-Is, rather than the low-z selection effect8.
On the other hand, as shown in Fig. 3, the distributions of both the ME and WE components for different SGRB-I-EE events show larger intrinsic scatter. Since LGRB-I and SGRB-I-EE events share similar phenomenological features, further exploration of the LGRB-I population can provide new insights into the study of merger-origin GRB events.
The introduction of a new empirical relation often inspires efforts to identify the underlying physical mechanisms, though the formulation of an adequate model to explain the remarkably linear relations in Fig. 3 remains a challenge. GRB production and propagation involve numerous complex physical processes that significantly influence the Ep,i, Eγ,iso, and T90,i properties across different events (Zhang 2018). Furthermore, the determination of these parameters is heavily affected by various selection biases, especially when the data from different experiments are considered (Qin et al. 2013)9. Accurately estimating unbiased GRB properties is virtually impossible, which adds to the complexity of interpreting the correlations we have identified for the ME and WE components of LGRB-Is. This is particularly puzzling when contrasted with the pure clustering behavior observed in SGRB-Is and GRB-IIs populations. We leave these questions to future investigations.
5. Conclusion
We collected a sample of redshift-known LGRB-I events to investigate their observed properties and explore potential universal correlations. Both the ME and WE phases of these bursts exhibit long durations, yet it is widely accepted that their origins are linked to mergers. Our analysis reveals that LGRB-Is display a broad range of Eγ,iso, regardless of whether the ME or WE components are considered. When focusing solely on the ME phases of LGRB-Is in the Ep,i−Eγ,iso domain, they show a stronger resemblance to SGRB-Is; however, this classification becomes ambiguous when the WE phases are included. We also examined the Ep−T90 domain and find that the ME components of all LGRB-I events align closely with the boundary between traditional SGRB-I and GRB-II populations. However, once the WE phases are considered, this alignment becomes less consistent, indicating a distinct shift in the observed trends.
Nevertheless, when we turn our attention to the EH−T90,i domain, we find that all LGRB-Is, regardless of whether the ME or WE components are considered, show a probable universal linear relationship in log–log space (see Fig. 3), one that had not until now been explored in detail. Their distribution also seems to occupy a distinct parameter space compared to traditional SGRB-Is and GRB-IIs. By incorporating the relations with the definition of EH, we further derived a power-law relationship for LGRB-Is between the three parameters Ep,i, Eγ,iso, and T90,i (see Eq. (4)).
The origin of and physical mechanism for the proposed universal correlation of LGRB-Is remain open questions. This is particularly evident when compared with the relatively weak correlations or lack of correlation observed in SGRB-Is both with and without EE emissions and GRB-II populations. The observed universality of our relations highlights the necessity for further investigation into the LGRB-I population. Considering the rapid development of both ground-based and space-based gravitational-wave astronomy, future multi-messenger observations of the potential associations between gravitational-wave events and LGRB-Is could provide further insights into the properties of the LGRB-I population (Yin et al. 2023; Kang et al. 2024; Morán-Fraile et al. 2024; Zhong et al. 2024b).
Acknowledgments
We would like to thank the anonymous referee for helpful comments and suggestions. We thank R. L. Becerra, Guangxuan Lan, Xishui Tian, Qinyuan Zhang, Jiahang Zhong, and Jinghao Zhang for useful discussions. YK, ZW, and LS are supported by the National SKA Program of China (2020SKA0120300), the Beijing Natural Science Foundation (1242018), and the Max Planck Partner Group Program funded by the Max Planck Society. YK is supported by the China Scholarship Council (CSC). ET and YYH are supported by the European Research Council through the Consolidator grant BHianca (grant agreement ID 101002761). JPZ acknowledges support from the Australian Research Council Centre of Excellence for Gravitational Wave Discovery (OzGrav) through project No. CE17010004.
Specifically, their bimodal lognormal distributions have mean values of ≃0.5 s for SGRBs and ≃30 s for LGRBs (Kouveliotou et al. 1993; McBreen et al. 1994). The overlap between the two distributions challenges a clear-cut distinction.
The spectroscopic redshift measurement for GRB 111117A is based on its host galaxy's emission lines (Selsing et al. 2018), and the estimated redshift is significantly higher than the previous estimation derived from photometric studies (Margutti et al. 2012; Sakamoto et al. 2013).
It is important to note that the derivation of Ep,i, Eγ,iso, and T90,i is significantly influenced by various selection effects, particularly when data from different experiments are considered. Actually, Minaev & Pozanenko (2020) have conducted analyses and reliability tests of the EH and EHD classification schemes with several selection effetcs. Additional discussions regarding detector-related aspects of our findings are provided in Sect. 4.
Sensitive GRB-associated SN searches are regularly undertaken for GRBs within z≲0.3 (Troja et al. 2022).
For GRB 230307A, which is exceptionally bright, the Fermi Gamma-ray Burst Monitor suffers from pulse pile-up and data loss during its ME phase. Spectral analysis typically excludes the post-trigger bad-time interval of 3−7 s (Dalessi 2023; Levan et al. 2024) and selects specific sodium iodide (na) and bismuth germanate (b1) detectors (Wang et al. 2023, 2025; Peng et al. 2024b).
Since the Ep,i (Ep) value for GRB 060505 lacks error information, we excluded it from the linear model fitting. However, as clearly shown in Fig. 3, we note that its position is close to our best-fit line.
We also examined the classification results based on EHD values (see Table A.1.), finding that LGRB-Is commonly show higher EHD values compared to most GRB-IIs. This is consistent with the results of Zhu & Tam (2024), which used alternative SGRB-I and GRB-II samples primarily derived from the Fermi catalog.
Reliable redshift measurements are crucial for accurate classification. LGRB-I events would shift toward the central region of the parameter space occupied by GRB-IIs if placed at higher redshifts. Such a scenario could arise if the redshift of a LGRB-I is inferred from a misidentified host galaxy, possibly due to the typically larger offsets from their true host galaxies, or the faintness of the actual hosts renders it challenging to identify (Troja et al. 2022). Consequently, the possibility that some phenomenological LGRBs have merger origins cannot be ruled out.
Nevertheless, taking GRB 230307A as an example, we compared results from Fermi and GECAM reports (Sun et al. 2025) and found discrepancies of only ≲5% in their log10(T90,i) and log10(Ep,i) values.
References
- Abac, A. G., Abbott, R., Abouelfettouh, I., et al. 2024, ApJ, 970, L34 [CrossRef] [Google Scholar]
- Abbott, B. P., Abbott, R., Abbott, T. D., et al. 2017a, ApJ, 848, L13 [CrossRef] [Google Scholar]
- Abbott, B. P., Abbott, R., Abbott, T. D., et al. 2017b, Phys. Rev. Lett., 119, 161101 [Google Scholar]
- Abbott, R., Abbott, T. D., Abraham, S., et al. 2021, ApJ, 915, L5 [NASA ADS] [CrossRef] [Google Scholar]
- Aghanim, N., Akrami, Y., Ashdown, M., et al. 2020, A&A, 641, A6; Erratum: A&A, 652, C4 (2021) [NASA ADS] [CrossRef] [EDP Sciences] [Google Scholar]
- Agüí Fernández, J. F., Thöne, C. C., Kann, D. A., et al. 2023, MNRAS, 520, 613 [CrossRef] [Google Scholar]
- Amati, L., Frontera, F., Tavani, M., et al. 2002, A&A, 390, 81 [NASA ADS] [CrossRef] [EDP Sciences] [Google Scholar]
- Butler, N. R., Kocevski, D., Bloom, J. S., & Curtis, J. L. 2007, ApJ, 671, 656 [Google Scholar]
- Chen, J., Shen, R. -F., Tan, W. -J., et al. 2024, ApJ, 973, L33 [Google Scholar]
- Connaughton, V. 2002, ApJ, 567, 1028 [CrossRef] [Google Scholar]
- Coulter, D. A., Foley, R. J., Kilpatrick, C. D., et al. 2017, Science, 358, 1556 [NASA ADS] [CrossRef] [Google Scholar]
- Dalessi, S., & Fermi GBM Team 2023, GCN, 33551, 1 [Google Scholar]
- Della Valle, M., Chincarini, G., Panagia, N., et al. 2006, Nature, 444, 1050 [NASA ADS] [CrossRef] [Google Scholar]
- Dichiara, S., Tsang, D., Troja, E., et al. 2023, ApJ, 954, L29 [NASA ADS] [CrossRef] [Google Scholar]
- Du, Z., Lü, H., Yuan, Y., Yang, X., & Liang, E. 2024, ApJ, 962, L27 [Google Scholar]
- Eichler, D., Livio, M., Piran, T., & Schramm, D. N. 1989, Nature, 340, 126 [NASA ADS] [CrossRef] [Google Scholar]
- Evans, P. A., Cenko, S. B., Kennea, J. A., et al. 2017, Science, 358, 1565 [NASA ADS] [CrossRef] [Google Scholar]
- Ferro, M., Brivio, R., D’Avanzo, P., et al. 2023, A&A, 678, A142 [NASA ADS] [CrossRef] [EDP Sciences] [Google Scholar]
- Fynbo, J. P. U., Watson, D., Thöne, C., et al. 2006, Nature, 444, 1047 [NASA ADS] [CrossRef] [Google Scholar]
- Gal-Yam, A., Fox, D., Price, P., et al. 2006, Nature, 444, 1053 [Google Scholar]
- Galama, T. J., Vreeswijk, P. M., van Paradijs, J., et al. 1998, Nature, 395, 670 [Google Scholar]
- Gao, H., Zhang, B., Lü, H. -J., & Li, Y. 2017, ApJ, 837, 50 [NASA ADS] [CrossRef] [Google Scholar]
- Gao, H., Lei, W. -H., & Zhu, Z. -P. 2022, ApJ, 934, L12 [NASA ADS] [CrossRef] [Google Scholar]
- Gehrels, N., Norris, J. P., Barthelmy, S. D., et al. 2006, Nature, 444, 1044 [NASA ADS] [CrossRef] [Google Scholar]
- Goldstein, A., Veres, P., Burns, E., et al. 2017, ApJ, 848, L14 [CrossRef] [Google Scholar]
- Gompertz, B. P., Gompertz, B. P., Salafia, O. S., et al. 2023, Nat. Astron., 7, 67 [Google Scholar]
- Gottlieb, O., Metzger, B. D., Quataert, E., et al. 2023, ApJ, 958, L33 [NASA ADS] [CrossRef] [Google Scholar]
- Gottlieb, O., Metzger, B. D., Foucart, F., & Ramirez-Ruiz, E. 2025, ApJ, 984, 77 [Google Scholar]
- Gruber, D., Goldstein, A., Weller von Ahlefeld, V., et al. 2014, ApJS, 211, 12 [Google Scholar]
- Jin, Z. -P., Li, X., Cano, Z., et al. 2015, ApJ, 811, L22 [NASA ADS] [CrossRef] [Google Scholar]
- Kagawa, Y., Yonetoku, D., Sawano, T., et al. 2019, ApJ, 877, 147 [Google Scholar]
- Kang, Y., Liu, C., Zhu, J. -P., et al. 2024, MNRAS, 528, 5309 [Google Scholar]
- Kasen, D. 2024, Nature, 626, 717 [Google Scholar]
- Kilpatrick, C. D., Foley, R. J., Kasen, D., et al. 2017, Science, 358, 1583 [NASA ADS] [CrossRef] [Google Scholar]
- Kouveliotou, C., Meegan, C. A., Fishman, G. J., et al. 1993, ApJ, 413, L101 [NASA ADS] [CrossRef] [Google Scholar]
- Krimm, H. A., Yamaoka, K., Sugita, S., et al. 2009, ApJ, 704, 1405 [NASA ADS] [CrossRef] [Google Scholar]
- Lazzati, D., Ramirez-Ruiz, E., & Ghisellini, G. 2001, A&A, 379, L39 [NASA ADS] [CrossRef] [EDP Sciences] [Google Scholar]
- Levan, A. J., Gompertz, B. P., Salafia, O. S., et al. 2024, Nature, 626, 737 [NASA ADS] [CrossRef] [Google Scholar]
- Li, L. -X., & Paczynski, B. 1998, ApJ, 507, L59 [NASA ADS] [CrossRef] [Google Scholar]
- Lü, H. -J., Yuan, H. Y., Yi, T. F., et al. 2022, ApJ, 931, L23 [CrossRef] [Google Scholar]
- MacFadyen, A., & Woosley, S. E. 1999, ApJ, 524, 262 [NASA ADS] [CrossRef] [Google Scholar]
- Margutti, R., Zaninoni, E., Bernardini, M. G., et al. 2012, ApJ, 756, 63 [NASA ADS] [CrossRef] [Google Scholar]
- McBreen, B., Hurley, K. J., Long, R., & Metcalfe, L. 1994, MNRAS, 271, 662 [Google Scholar]
- Meng, Y. -Z., Wang, X. I., & Liu, Z. -K. 2024, ApJ, 963, 112 [Google Scholar]
- Metzger, B. D., Martinez-Pinedo, G., Darbha, S., et al. 2010, MNRAS, 406, 2650 [NASA ADS] [CrossRef] [Google Scholar]
- Minaev, P. Y., & Pozanenko, A. S. 2020, MNRAS, 492, 1919; Erratum: MNRAS,504, 926–927 (2021) [NASA ADS] [CrossRef] [Google Scholar]
- Montanari, E., Frontera, F., Guidorzi, C., & Rapisarda, M. 2005, ApJ, 625, L17 [Google Scholar]
- Morán-Fraile, J., Röpke, F. K., Pakmor, R., et al. 2024, A&A, 681, A41 [NASA ADS] [CrossRef] [EDP Sciences] [Google Scholar]
- Narayan, R., Paczynski, B., & Piran, T. 1992, ApJ, 395, L83 [NASA ADS] [CrossRef] [Google Scholar]
- Norris, J. P., & Bonnell, J. T. 2006, ApJ, 643, 266 [NASA ADS] [CrossRef] [Google Scholar]
- Norris, J. P., Gehrels, N., & Scargle, J. D. 2010, ApJ, 717, 411 [NASA ADS] [CrossRef] [Google Scholar]
- Ofek, E. O., Cenko, S. B., Gal-Yam, A., et al. 2007, ApJ, 662, 1129 [Google Scholar]
- Paczynski, B. 1986, ApJ, 308, L43 [NASA ADS] [CrossRef] [Google Scholar]
- Paczynski, B. 1991, Acta Astron., 41, 257 [NASA ADS] [Google Scholar]
- Paczynski, B. 1998, ApJ, 494, L45 [Google Scholar]
- Peng, Z. -K., Liu, Z. -K., Zhang, B. -B., & Gao, H. 2024a, ApJ, 967, 156 [Google Scholar]
- Peng, Z. -Y., Chen, J. -M., & Mao, J. 2024b, ApJ, 969, 26 [Google Scholar]
- Pian, E., D’Avanzo, P., Benetti, S., et al. 2017, Nature, 551, 67 [Google Scholar]
- Qin, Y., Liang, E. -W., Liang, Y. -F., et al. 2013, ApJ, 763, 15 [NASA ADS] [CrossRef] [Google Scholar]
- Rastinejad, J. C., Gompertz, B. P., Levan, A. J., et al. 2022, Nature, 612, 223 [NASA ADS] [CrossRef] [Google Scholar]
- Sakamoto, T., Troja, E., Aoki, K., et al. 2013, ApJ, 766, 41 [NASA ADS] [CrossRef] [Google Scholar]
- Salvaterra, R., Della Valle, M., Campana, S., et al. 2009, Nature, 461, 1258 [NASA ADS] [CrossRef] [PubMed] [Google Scholar]
- Savchenko, V., Ferrigno, C., Kuulkers, E., et al. 2017, ApJ, 848, L15 [NASA ADS] [CrossRef] [Google Scholar]
- Selsing, J., Krühler, T., Malesani, D., et al. 2018, A&A, 616, A48 [NASA ADS] [CrossRef] [EDP Sciences] [Google Scholar]
- Shahmoradi, A., & Nemiroff, R. J. 2015, MNRAS, 451, 126 [NASA ADS] [CrossRef] [Google Scholar]
- Sun, H., Wang, C., Yang, J., et al. 2025, Natl. Sci. Rev., 12, nwae401 [Google Scholar]
- Tanvir, N. R., Fox, D. B., Levan, A. J., et al. 2009, Nature, 461, 1254 [Google Scholar]
- Thone, C. C., Fynbo, J. P. U., Östlin, G., et al. 2008, ApJ, 676, 1151 [CrossRef] [Google Scholar]
- Troja, E., Piro, L., van Eerten, H., et al. 2017, Nature, 551, 71 [NASA ADS] [CrossRef] [Google Scholar]
- Troja, E., Fryer, C. L., O’Connor, B., et al. 2022, Nature, 612, 228 [NASA ADS] [CrossRef] [Google Scholar]
- Villasenor, J. S., Lamb, D. Q., Ricker, G. R., et al. 2005, Nature, 437, 855 [Google Scholar]
- von Kienlin, A., Meegan, C. A., Paciesas, W. S., et al. 2020, ApJ, 893, 46 [Google Scholar]
- Wang, Y., Xia, Z. -Q., Zheng, T. -C., Ren, J., & Fan, Y. -Z. 2023, ApJ, 953, L8 [Google Scholar]
- Wang, X. I., Yu, Y. -W., Ren, J., et al. 2024, ApJ, 964, L9 [Google Scholar]
- Wang, C. -W., Tan, W. J., Xiong, S. L., et al. 2025, ApJ, 979, 73 [Google Scholar]
- Woosley, S. E. 1993, ApJ, 405, 273 [Google Scholar]
- Woosley, S. E., & Bloom, J. S. 2006, ARA&A, 44, 507 [Google Scholar]
- Woosley, S. E., Eastman, R. G., & Schmidt, B. P. 1999, ApJ, 516, 788 [NASA ADS] [CrossRef] [Google Scholar]
- Yang, B., Jin, Z. -P., Li, X., et al. 2015, Nat. Commun., 6, 7323 [NASA ADS] [CrossRef] [Google Scholar]
- Yang, J., Ai, S., Zhang, B. -B., et al. 2022, Nature, 612, 232 [NASA ADS] [CrossRef] [Google Scholar]
- Yang, Y. -H., Troja, E., O’Connor, B., et al. 2024, Nature, 626, 742 [NASA ADS] [CrossRef] [Google Scholar]
- Yin, Y. -H. I., Zhang, B. -B., Sun, H., et al. 2023, ApJ, 954, L17 [Google Scholar]
- Zaninoni, E., Bernardini, M. G., Margutti, R., & Amati, L. 2016, MNRAS, 455, 1375 [Google Scholar]
- Zhang, B. 2018, The Physics of Gamma-Ray Bursts (Cambridge: Cambridge University Press) [Google Scholar]
- Zhang, B. 2025, J. High Energy Astrophys., 45, 325 [Google Scholar]
- Zhang, B., Zhang, B. -B., Liang, E. -W., et al. 2007, ApJ, 655, L25 [NASA ADS] [CrossRef] [Google Scholar]
- Zhang, B., Zhang, B. -B., Virgili, F. J., et al. 2009, ApJ, 703, 1696 [NASA ADS] [CrossRef] [Google Scholar]
- Zhang, B. B., Zhang, B., Sun, H., et al. 2018, Nat. Commun., 9, 447 [NASA ADS] [CrossRef] [Google Scholar]
- Zhang, X. L., Zhang, C. T., Li, X. J., et al. 2020, Res. Astron. Astrophys., 20, 201 [Google Scholar]
- Zhang, H. -M., Huang, Y. -Y., Zheng, J. -H., Liu, R. -Y., & Wang, X. -Y. 2022, ApJ, 933, L22 [Google Scholar]
- Zhong, S. -Q., Li, L., & Dai, Z. -G. 2023, ApJ, 947, L21 [NASA ADS] [CrossRef] [Google Scholar]
- Zhong, S. -Q., Li, L., Xiao, D., et al. 2024a, ApJ, 963, L26 [Google Scholar]
- Zhong, S. -Q., Meng, Y. -Z., & Gu, J. -H. 2024b, Phys. Rev. D, 110, 083001 [Google Scholar]
- Zhu, S. -Y., & Tam, P. -H. T. 2024, ApJ, 976, 62 [Google Scholar]
- Zhu, J. -P., Wu, S., Yang, Y. -P., et al. 2021, ApJ, 921, 156 [NASA ADS] [CrossRef] [Google Scholar]
- Zhu, J. -P., Wang, X. I., Sun, H., et al. 2022, ApJ, 936, L10 [NASA ADS] [CrossRef] [Google Scholar]
- Zhu, J. -P., Hu, R. -C., Kang, Y., et al. 2024, ApJ, 974, 211 [NASA ADS] [CrossRef] [Google Scholar]
Appendix A: LGRB-I sample and the WE properties of SGRB-I-EE events
We present the sample of LGRB-I events and their properties in Table A.1. to serve the analysis in the main text. The three redshift-known LGRBs, GRB 060614, GRB 211211A and GRB 230307A exhibit KN signals with merger origins. Additionally, we included two nearby (z≲0.3) LGRBs with known redshifts but without expected SN observations: GRB 060505 and GRB 211227A. Given that the Ep,i (Ep), Eγ,iso, and T90,i (T90) values for SGRB-I-EE events in the MP sample are derived exclusively from their ME phases, with the EE components excluded, we additionally collected their WE properties (see Table A.2.).
Sample of LGRB-Is and their properties.
WE properties of SGRB-I-EE events in the MP sample.
All Tables
All Figures
|
Fig. 1. Ep,i−Eγ,iso relations for GRBs with known redshifts. All error bars correspond to 1σ confidence intervals. The solid lines and shaded areas represent the best-fit correlations and the 90% credible intervals, respectively, for SGRB-Is (blue) and GRB-IIs (red). Solid squares and diamonds represent the properties of ME and WE phases for our LGRB-I sample, respectively. |
| In the text | |
|
Fig. 2. GRB classification diagram in the Ep−T90 domain. The crosses and circles represent the known classification of SGRB-Is and GRB-IIs in the MP sample. The different colors indicate the probability of a GRB event being a SGRB-I (PSGRB−I) based on two independent two-dimensional Gaussian components. The dashed cyan line indicates the dividing line with PSGRB−I = 0.5. In the top and right projected histograms, the blue and red lines represent the contributions from SGRB-I candidates (smaller T90, larger Ep) and GRB-II candidates (larger T90, smaller Ep), while the black lines are the combined distributions of two Gaussian components. |
| In the text | |
|
Fig. 3. GRB classification diagram in the EH−T90,i domain. The colorbar now indicates the redshift. The ME and WE components of SGRB-I-EE events are denoted by the left- and right-pointing triangles, respectively. The best-fit EH−T90,i correlation is shown as a solid line, with the 90% credible intervals indicated by dashed lines. GRB 980425B (EH = 8.72) and GRB 171205A (EH = 5.78) are labeled. |
| In the text | |
Current usage metrics show cumulative count of Article Views (full-text article views including HTML views, PDF and ePub downloads, according to the available data) and Abstracts Views on Vision4Press platform.
Data correspond to usage on the plateform after 2015. The current usage metrics is available 48-96 hours after online publication and is updated daily on week days.
Initial download of the metrics may take a while.