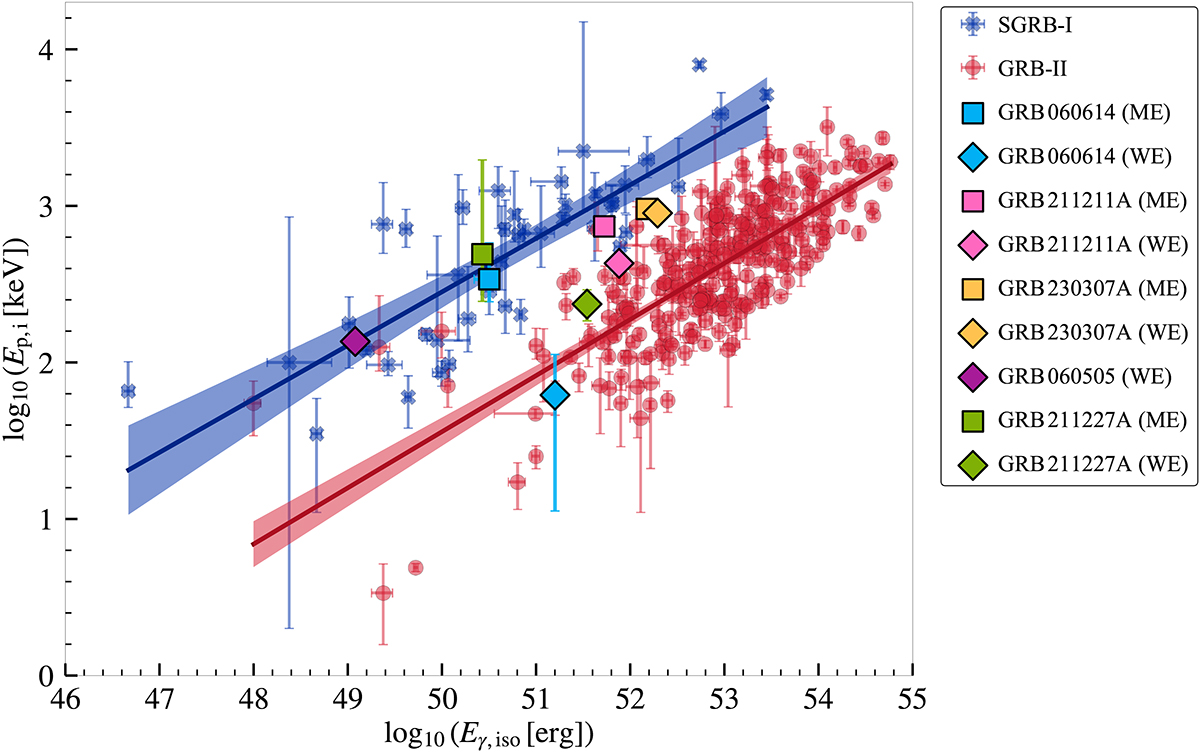
Fig. 1.
Download original image
Ep,i−Eγ,iso relations for GRBs with known redshifts. All error bars correspond to 1σ confidence intervals. The solid lines and shaded areas represent the best-fit correlations and the 90% credible intervals, respectively, for SGRB-Is (blue) and GRB-IIs (red). Solid squares and diamonds represent the properties of ME and WE phases for our LGRB-I sample, respectively.
Current usage metrics show cumulative count of Article Views (full-text article views including HTML views, PDF and ePub downloads, according to the available data) and Abstracts Views on Vision4Press platform.
Data correspond to usage on the plateform after 2015. The current usage metrics is available 48-96 hours after online publication and is updated daily on week days.
Initial download of the metrics may take a while.