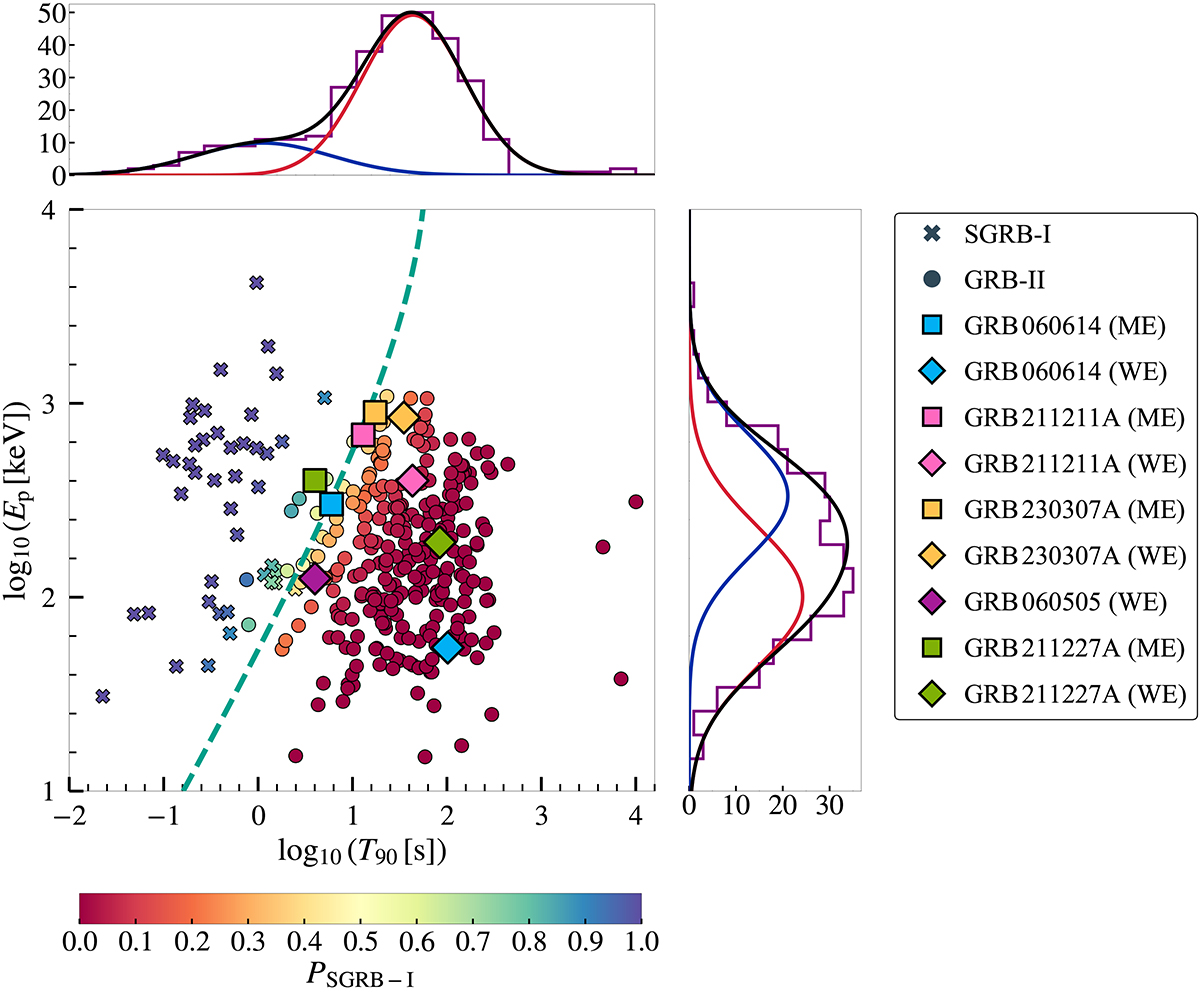
Fig. 2.
Download original image
GRB classification diagram in the Ep−T90 domain. The crosses and circles represent the known classification of SGRB-Is and GRB-IIs in the MP sample. The different colors indicate the probability of a GRB event being a SGRB-I (PSGRB−I) based on two independent two-dimensional Gaussian components. The dashed cyan line indicates the dividing line with PSGRB−I = 0.5. In the top and right projected histograms, the blue and red lines represent the contributions from SGRB-I candidates (smaller T90, larger Ep) and GRB-II candidates (larger T90, smaller Ep), while the black lines are the combined distributions of two Gaussian components.
Current usage metrics show cumulative count of Article Views (full-text article views including HTML views, PDF and ePub downloads, according to the available data) and Abstracts Views on Vision4Press platform.
Data correspond to usage on the plateform after 2015. The current usage metrics is available 48-96 hours after online publication and is updated daily on week days.
Initial download of the metrics may take a while.