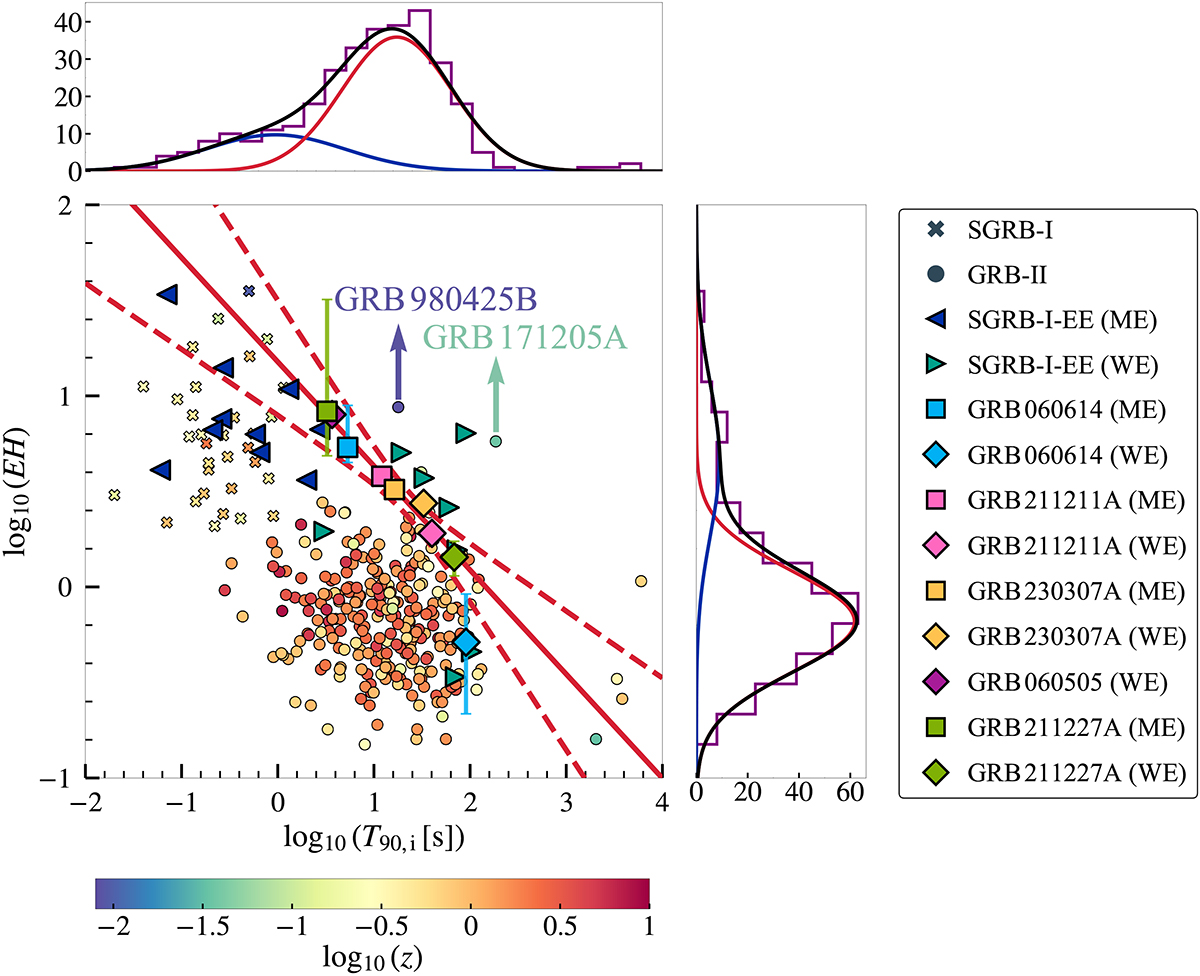
Fig. 3.
Download original image
GRB classification diagram in the EH−T90,i domain. The colorbar now indicates the redshift. The ME and WE components of SGRB-I-EE events are denoted by the left- and right-pointing triangles, respectively. The best-fit EH−T90,i correlation is shown as a solid line, with the 90% credible intervals indicated by dashed lines. GRB 980425B (EH = 8.72) and GRB 171205A (EH = 5.78) are labeled.
Current usage metrics show cumulative count of Article Views (full-text article views including HTML views, PDF and ePub downloads, according to the available data) and Abstracts Views on Vision4Press platform.
Data correspond to usage on the plateform after 2015. The current usage metrics is available 48-96 hours after online publication and is updated daily on week days.
Initial download of the metrics may take a while.