| Issue |
A&A
Volume 698, June 2025
|
|
|---|---|---|
| Article Number | A202 | |
| Number of page(s) | 11 | |
| Section | Interstellar and circumstellar matter | |
| DOI | https://doi.org/10.1051/0004-6361/202554245 | |
| Published online | 16 June 2025 | |
Photoionization of small neutral polycyclic aromatic hydrocarbons
Testing photoelectric models of interstellar dust
1
Synchrotron SOLEIL, L’Orme des Merisiers,
91192
Gif sur Yvette Cedex,
France
2
Present address: LISA UMR 7583 Université Paris-Est Créteil and Université de Paris, Institut Pierre et Simon Laplace,
61 Avenue du Général de Gaulle,
94010
Créteil,
France
3
Institut d’Astrophysique Spatiale (IAS), CNRS, Univ. Paris Sud / Université Paris-Saclay,
91405
Orsay,
France
4
Institut des Sciences Moléculaires d’Orsay, CNRS, Université Paris-Saclay,
91405
Orsay,
France
★ Corresponding author: This email address is being protected from spambots. You need JavaScript enabled to view it.
Received:
24
February
2025
Accepted:
30
April
2025
Abstract
Context. In the interstellar medium (ISM) and circumstellar environments, photoionization, or the photoelectric effect, emerges as a prevalent phenomenon. In regions exposed to UV photons, either stellar or secondary photons induced by cosmic rays, polycyclic aromatic hydrocarbons (PAHs) liberate electrons through the photoelectric effect, efficiently contributing to the heating budget of the gas. In contrast to shielded areas, neutral and cationic PAHs can scavenge electrons and retain a significant portion of the cloud’s electronic charge. This dual behavior of PAHs not only influences the gas thermal and dynamical behavior but also plays a pivotal role in shaping the chemistry of the environments.
Aims. Our aim was to measure the photoelectron kinetic energy distribution (KED) of PAHs of varying sizes, symmetries, and C:H ratios to describe the photoelectron KED with a law that can be implemented in astrophysical photoelectric models that describe gas heating.
Methods. We used a double-imaging photoelectron photoion coincidence spectrometer coupled with the DESIRS VUV beamline at the SOLEIL synchrotron to record the gas-phase spectra of a series of sublimated PAHs with different sizes and structures in the 13–20 C atom range. We then compared our data to current astrophysical dust photoelectric models used to describe the PAH charge and gas photoelectric heating in the ISM. In particular, we extended the Kimura 2016, (MNRAS, 459, 2751) model (eK16) to take into account the KED of the photoelectron and its interaction with the grain.
Results. We show that although subtle differences between the molecules in our dataset arise from individual electronic structures, the photoelectron KED of PAHs of different sizes and symmetry display remarkable similarities. A general law can thus be implemented in sophisticated ISM astrochemical models to describe their photoelectron KED behavior. We find that the eK16 photoelectric model closely reproduces the present photoionization cross sections of neutral, small PAHs as well as literature data obtained on cationic PAHs. It is noteworthy that the eK16 model, unlike former models, matches the absolute scale of the measured photoionization cross sections. We show that the eK16 model predicts a maximum photoelectric efficiency significantly lower than the previous models, implying a lower interstellar gas temperature and less emission.
Key words: molecular data / methods: laboratory: molecular / dust, extinction / ISM: molecules / photon-dominated region (PDR) / ultraviolet: ISM
© The Authors 2025
 Open Access article, published by EDP Sciences, under the terms of the Creative Commons Attribution License (https://creativecommons.org/licenses/by/4.0), which permits unrestricted use, distribution, and reproduction in any medium, provided the original work is properly cited.
This article is published in open access under the Subscribe to Open model. This email address is being protected from spambots. You need JavaScript enabled to view it. to support open access publication.
1 Introduction
Polycyclic aromatic hydrocarbons (PAHs) are ubiquitous molecular species encountered in a wide variety of environments. PAHs were initially suggested to be important components of the interstellar medium (ISM; Leger & Puget 1984; Allamandola et al. 1985) due to their inherent fluorescence emission mechanism in the infrared, which could be the origin of the aromatic infrared bands (Li 2020). These photo-physical properties led to the “PAH hypothesis” and, since then, this family of molecules has triggered a large number of experimental, theoretical, and observational studies, which were recently reviewed by Hrodmarsson et al. (2025).
It has long been known that in UV-irradiated interstellar regions, the gas is mostly heated by energetic, or “hot”, photoelectrons extracted from small (nanometric) dust grains via the photoelectric effect (PE; e.g., Draine 1978; Tielens & Hollenbach 1985). Several other articles discussing photoelectric heating due to PAHs followed (d’Hendecourt & Leger 1987; Verstraete et al. 1990; Bakes & Tielens 1994; Weingartner & Draine 2001; Habart et al. 2001). These processes have also been discussed in the context of the global dust spectral energy distribution. The ionization of PAHs is also suggested to play a dominant role in the gas thermal budget. A related aspect is that PAHs can carry a significant fraction of the charge of interstellar regions, which is important for the coupling of the magnetic field to the gas (Zhao et al. 2016). Both processes, the gas photoelectric heating and the charge carried by PAHs, are thus key to understanding star formation efficiency and feedback (Berné et al. 2022a). The gas photoelectric heating by PAHs has recently been discussed by Berné et al. (2022b), who used the most up-to-date experimental results on the vacuum-UV (VUV) photoionization of PAH cations (Zhen et al. 2016; Wenzel et al. 2020) and show that PAH ionization is the likely source of gas heating in a variety of environments.
The ionization energies (IEs) of PAHs are molecule-dependent and are typically assumed to also depend on a PAH’s size and structure, but their values remain in a limited range: from ~7 eV (for NC > 40) to ~8 eV for naphthalene (NC = 10). As these values are significantly below the neutral gas (H I) cutoff of 13.6 eV, they allow the production of energetic photoelectrons. Moreover, the photoionization cross sections of PAHs (usually considered to be proportional to the number of carbon atoms) are quite large near their maximum value, namely ~25–35 MBarn (10−18 cm2) per C atom (Verstraete et al. 1990; Johansson et al. 2017a) for photon energies (hv) around 17 eV, with large values between 10 and 13.6 eV. Consequently, a significant part of PAHs in space ought to be present in their cationic forms along with an equivalent number of photoelectrons ejected by these single photoionization events. Their kinetic energy (KE) is determined by the final cation states as
![Mathematical equation: $\[\mathrm{KE}=h\nu-\left(\mathrm{IE}+E_{\mathrm{i}}\right),\]$](/articles/aa/full_html/2025/06/aa54245-25/aa54245-25-eq1.png) (1)
(1)
where Ei is the final vibronic energy of the cation. These fast photoelectrons can transfer part of their KE to any collision partner available in the local ISM. This whole process (fast photoelectron production plus collisional energy transfer) is responsible for the so-called photoelectric heating of the ISM and thus plays a pivotal role in the equilibria of ISM models.
A plethora of experimental studies involving the interactions between (V)UV photons and PAHs have been carried out. Photoion yields of multiple PAHs and PAH cations were obtained by Tobita et al. (1994), Jochims et al. (1997, 1999), Zhen et al. (2015, 2016), Douix et al. (2017), and Wenzel et al. (2020), and photoionization efficiencies of PAHs were measured by Jochims et al. (1996). The dissociative photoionization of nitrogen-containing PAHs (PANHs) has been reported based on photoion yields (Leach et al. 2018) and likewise for PAHs containing an ethynyl (−C2H) group (Rouillé et al. 2015). Multiple studies of the UV-induced photodissociation of PAHs exist (Jochims et al. 1994; Ekern et al. 1998; Marciniak et al. 2021), and photoionization cross sections have been measured and investigated in the context of combustion science (Johansson et al. 2017a,b). So-called mass-selected threshold photoelectron spectroscopy (ms-TPES; Baer & Tuckett 2017) has also been widely used to characterize the vibronic structure of PAH cations (Bréchignac et al. 2014), PAH clusters (Joblin et al. 2017), PANHs (Schleier et al. 2022; Roy Chowdhury et al. 2024), and oxygenated PAHs (Mayer & Bodi 2021), and to study their dissociative ionization (West et al. 2014a,b; Bouwman et al. 2015; West et al. 2019; Rouillé et al. 2019; Bouwman et al. 2021; Kadhane et al. 2022; Ramanathan et al. 2022; Bull et al. 2023).
We have conducted a systematic study to characterize in detail the photoionization behavior of a series of nine PAHs, covering a broad size range (NC = 13–20) as well as a broad structural range in terms of compactness, the presence or absence of pentagons, methyl-substitutions and their location, and planarity. These nine PAHs along with their chemical formulae and structures are presented in Table 1. For a majority of them, we also obtained information on the dissociative ionization channels, covering one to three H losses. We present these PAHs in 2D matrices that show the number of ionization events as a function of photon energy and electron KE for a given cation mass, as was previously done for coronene and the coronene dimer by Bréchignac et al. (2014). These so-called 2D photoelectron spectroscopy (PES) matrices contain a wealth of spectroscopic and dynamical information, which is generally reduced further to 1D projections (Hrodmarsson et al. 2020). These include projections along the photon energy axis such as the TPES, which is obtained by summing over: (i) slow photoelectrons (typically a few to a few tens of meV; see Poully et al. (2010), (ii) the total ion yield (TIY), which itself is obtained by summing over all the electron KEs, or (iii) the constant ionic state (CIS), which appears along diagonal lines and shows the ionization signal in a given ionic state. The TIY and CIS are useful when studying continuum resonances, such as autoionizations and shape resonances, respectively, which can greatly affect the electron kinetic energy distributions (KEDs). A vertical cut produces classical PES at any photon wavelength, and an integrated PES where the electron KED is obtained by summing the PES over given photon energies. This is of interest for obtaining the electron KED for a given incident photon spectrum.
In this work, we present 2D photoelectron matrices and analyze their TPES and TIYs, as well as the electron KEDs for nine PAHs. In Sect. 2, we describe the performed experiments and in Sect. 3 the results. In Sect. 4 we utilize these results to model the photoelectron KEDs of different regions and compare them with other recent state-of-the-art models that incorporate the photoelectric heating of PAHs in space.
PAHs studied in this work.
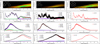 |
Fig. 1 From top to bottom: 2D photoelectron spectrum matrix matrices, threshold photoelectron spectra, electron kinetic energy, and TIYs for (from left to right) benzo[c]phenanthrene, triphenylene, and corannulene. |
2 Experimental
Experiments were performed at the DESIRS VUV beamline (Nahon et al. 2012) at the Synchrotron SOLEIL facility in St. Aubin, France. Horizontally polarized radiation in the photon energy range 7–22 eV was generated by an undulator whose higher harmonics were suppressed by four to five orders of magnitude up to 14 eV with a gas filter filled with krypton. Above 14 eV transmission of higher (>1) orders by the monochromator grating is considered negligible. Downstream of the gas filter, a 6.65 m normal incidence monochromator equipped with a 200 grooves per millimeter grating dispersed the photon beam. The monochromator slits were adjusted to avoid saturation of the charged particle detectors and provided photon resolutions in the 2–22 meV range. The monochromatized photon beam intersected a supersonic molecular beam at a right angle inside the double imaging photoelectron photoion coincidence (i2PEPICO) DELICIOUS III spectrometer (Garcia et al. 2013) of the permanent end station SAPHIRS (Tang et al. 2015). Inside DELICIOUS III, photoions and photoelectrons were accelerated in opposite directions with a DC electric field and then detected in coincidence with delay line anode-based position sensitive detectors. The electrons were analyzed through a velocity map imaging spectrometer, and the ions went through a modified Wiley McLaren time-of-flight 3D momentum imaging spectrometer. The spectrometer’s extraction field was set to 440 V/cm, which provided full transmission for photoelectrons up to 18 eV KE, and therefore there was no electron discrimination within the studied photon energy range. Photoelectron images were recorded at different photon energies in the range 7.0–22 eV, mostly with steps of 100 meV, and Abel-inverted (Garcia et al. 2004) providing mass-selected photoelectron spectra. The overall dataset for a given mass, i.e., for a given PAH, are presented as 2D matrices, from which spectroscopic and photoionization dynamics information can be retrieved (see the introduction).
All the data have been corrected by the photon flux measured with a Si photodiode (AXUV100, IRD). To avoid artifacts linked to vaporization process instabilities, fast scans were recorded in some cases, and have been used to further correct the shape of the spectra.
The nine PAH species investigated in this work were placed in an in-vacuum stainless steel oven operated with resistive heating (Tia et al. 2013). The oven temperature was adjusted to generate enough partial pressure for each species and varied from 100°C for fluorene to 225°C for corannulene. The PEPICO scheme allows the electron images to be mass-tagged to simultaneously record the spectra of PAHs of different masses but similar sublimation temperatures with a considerable gain in acquisition time highly coveted in large access facilities. Therefore, phenanthrene, fluoranthene, and perylene were measured simultaneously as were 3-methylphenanthrene and benzo[c]phenanthrene. Helium was flowed across the oven at a pressure of 0.5 bars to expand the vaporized neutral PAHs through a 100 μm nozzle producing a supersonic molecular beam that was doubly skimmed (skimmer diameters ϕ = 1 mm and 2 mm) prior to entering the ionization chamber.
3 Results
The results for three examples of PAHs are presented in Fig. 1, namely benzo[c]phenanthrene, triphenylene, and corannulene. The results include, from top to bottom, the 2D photoelectron spectrum matrices, the TPES, the electron KED, and the TIY. The same results for 3-methylphenanthrene, 4-methylphenanthrene, and phenanthrene are displayed in Fig. 2 and those for fluorene, perylene, and fluoranthene are displayed in Fig. 3. As the article is focused on the PE, the spectroscopy, state-selected fragmentation, and TIYs, are only briefly discussed below. Nevertheless, we report on several fundamental properties of PAHs derived from the results such as IEs and appearance energies for different fragments. These are displayed along with the data available in the literature for comparison in Table 2.
Total ion yields of multiple PAHs have been measured by Jochims et al. (1994), who found that PAHs containing fewer than 30–40 carbon atoms are less likely to survive in irradiated H I regions. Although they did not present all of the TIY curves, they did provide the IEs and fragment appearance energies for a number of the PAHs presented here, namely perylene, triphenylene, fluoranthene, and phenanthrene.
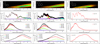 |
Fig. 2 Same as Fig. 1 but for (from left to right) 3-methylphenanthrene, 4-methylphenanthrene, and phenanthrene. |
IEs, observed fragment appearance energies, and comparisons with previous works.
3.1 Spectroscopy
The TPES of the PAHs in this work present spectral structures that all share many commonalities. Generally speaking, the number of bands expected from a photoelectron spectrum of PAHs is expected to scale with the number of occupied levels. The number of electronic bands is directly related to the number of carbon atoms contributing an electron to the π system of the PAH, as well as the symmetry of the PAH (Schmidt 1977). The vibrational structure within each band is a bit more nuanced, however. Among the factors governing vibrational structure in different bands is non-planarity. If the PAHs are nonplanar the vibrational structure is quenched so that all bands assume similarly symmetrical shapes. This is partly observed in the spectrum of phenanthrene and the methyl-phenanthrenes. PAHs with a threeor six-fold axis of symmetry (like triphenylene) may also manifest Jahn-Teller distortions, giving rise to complex, unresolved, and broadened vibrational components.
In the case of the nine PAHs measured here, the first band is very sharp, consisting of a short vibrational progression but the large energy step (800 cm−1) in most of the experiments plus the absence of Franck-Condon simulations precludes a full analysis. The second bands tend to be diffuse and the third bands sharp again. In this spectral region the several bands present a variety of vibrational structure, some involving certain progressions while others display more diffuse envelopes. Distinctions between sharp and diffuse bands in the TPES of PAHs are typically related to the structural motifs present in the different PAHs; for example, the C/H ratio is directly related to the compactness of the PAH skeleton, presence of pentagons, and other functional groups, but the individual effects of each structural motif are rather vaguely understood.
In such large molecules as PAHs, there are so many normal modes that calculated vibrational intensity distributions over the closely spaced modes are very sensitive to the accuracy of normal coordinates (Ohno 1979). In a nutshell, different modes such as Kekulé type (C–C stretching of circa 1350 cm−1) and low-frequency type modes (C–C–C bending and C–C stretching of circa 260–510 cm−1) can be activated upon ionization that give rise to the different bands observed in the TPES. The selective activities of specific modes are related to their characteristic molecular orbitals. A full description of the relation between selective activities of the different modes by the different molecular orbital holes created by the loss of an electron is given by Ohno (1979). For what concerns the current work, we provide only the first ionization threshold of the nine species in Table 2, obtained as the maximum of the first band, which should be close to the adiabatic value.
3.2 State-selected fragmentation
Equation 1 shows that by fixing the electron KE to zero, the excess energy of the cation can be precisely set to hv–IE. Varying hv yields the state-selected fragmentation pattern of the cation, i.e., the ms-TPES also known as the TPEPICO curves. Several dissociative ionization thresholds are observed for the losses of H, 2H/H2, and in the cases of 3- and 4-methylpyrene, 3H.
The observed thresholds for H and 2 H losses and comparisons with previous measurements where available are shown in Table 2. The observed thresholds for the loss of three H atoms from 3- and 4-methylphenanthrene were 16.95 and 15.70 eV, respectively.
We note some discrepancies in the comparison with previous works that are due to a kinetic shift in our apparatus (Lifshitz 1982). Kinetic shifts stem from differences in experimental analysis times and detection limits in setups. In our case, with an ion residence time in the acceleration region of DELICIOUS III on the order of microseconds, kinetic shifts of approximately 1 eV can be observed for the loss of H in PAH systems (Jochims et al. 1994, 1999). We note that in the case of phenanthrene, the signal at higher energies was very low because the sample was depleted and no fragments could be observed although other studies have documented the appearance of fragments above 15 eV (Gotkis et al. 1993; Rouillé et al. 2015). Comparison to existing photoelectron spectra (Maier & Turner 1972; Hush et al. 1975) shows that our phenanthrene data below 13.6 eV can be exploited nonetheless. Similarly, the corannulene cation was predicted to lose an H atom and H2 at 4.96 eV and 8.20 eV above its IE, respectively (Sundararajan et al. 2024). The fragments should therefore appear at approximately 13.9 and 16.1 eV. However, because of the kinetic shift, these fragmentations are not observed.
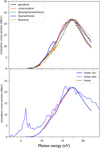 |
Fig. 4 Panel a: comparison of the ionization cross sections for some of the molecules studied (see the legend). All cross sections have been scaled to 22 Mb/C on the 17 eV peak. Panel b: average of the cross sections shown above. There is a clear a linear increase from 10 to 17 eV, as already noted in Johansson et al. (2017a). |
3.3 Ionization cross sections
The TIY curves measured here are proportional to the ionization cross section of each molecule. The top panel of Fig. 4 shows scaled cross sections of a subset of our molecule sample that covers some diversity in both structure and size. We note that below 15 eV the coronene and pyrene cross sections (not shown) measured by Verstraete et al. (1990) also fall well within the curves presented here. These cross sections display similar characteristics with a rapid rise after threshold followed by a linear rise toward the peak at 17 eV. This peak is often assigned to a plasmon resonance1 that can be pictured as an oscillation of the electronic cloud of the molecule as a response to the loss of an electron from the valence orbital. This resonance is well known for PAHs containing fewer than 100 C atoms (Keller et al. 1992; Manjavacas et al. 2013; Chapkin et al. 2020; Bagdia et al. 2021) as well as fullerenes (Keller & Coplan 1992), with a frequency strongly dependent on the charge state of the PAH.
Manjavacas et al. (2013) computed the plasmon resonances in triphenylene (middle panel of Fig. 1) and found that upon the removal of an electron, the cation exhibited a plasmon resonance just below 2 eV with a much smaller one at 1.7 eV. The activated modes behind the plasmon resonances were found to have a strong dipole character; in fact, they correspond to the C–C–C stretches responsible for the diffuse bands observed in the TPES. The 2D photoelectron spectrum verifies that the main contribution to plasmon resonance in triphenylene is provided by photoelectrons ejected from PAH cations with activated C–C–C stretches, i.e., those corresponding to the TPES signals between 10 and 14 eV, and not from ionization processes leading to the ground state cation. We draw the same conclusion for the other molecules studied here.
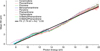 |
Fig. 5 Mean KE, ⟨KE⟩, of the extracted photoelectrons for the nine PAHs of our sample and for all photon energies, hν (colored curves). The solid black line shows that a linear fit of slope 0.55 is a good representation of the relationship between ⟨KE⟩ and hv. |
3.4 Photoelectron kinetic energy distribution
A priori, the photoelectron energy distributions depend strongly on the molecular and electronic structures. They also depend on the photon wavelength, as seen in Eq. (1). Beyond this equation, the partial cross sections for the ionization of individual orbitals also depend on the KE. It is therefore remarkable that the KEDs appear to be similar, as shown in Fig. A.1, which plots the nine distributions as obtained with a flat photon field, i.e., summing the PES over all photon energies. There are at least two reasons for this similarity: the loss of spectroscopic information upon integration over the photon energy, hv, and the prevalence of the plasmon resonance, which peaks around the same KE for the nine PAHs.
As a counterexample, Fig. A.2 shows the electron kinetic energy release distributions at the Lyman-α wavelength that displays the sensitivity to molecular structure when the data are not integrated over hν. To provide a simple and meaningful relationship between photon energy and electron KE that can be easily incorporated into photochemical models, we extracted the mean electron KE as a function of photon energy, presented in Fig. 5. The individual trends for each species display a quasi-linear relationship and exhibit similar slopes, mainly differing in the photon energy offset, i.e., their first IE.
A linear empirical law for the photoelectron KE for a diverse sample of PAHs can be derived from Fig. 5 by performing a least squares linear fit of the data, which yields the expression: ⟨K E⟩ = 0.55 × (hν − 7.74), where the mean KE can be approximated by a linear model with an ionization threshold of IE=7.74 eV and a slope of 0.55. Note that the slope represents the energy sharing between the cation and electron, i.e., the cation internal energy. For instance, ionization of the helium atom where the cation cannot accumulate energy below 40.8 eV excess energy, the slope would be unity. Therefore, in our large energy range, the slope depends mainly on the number of electronic states and their relative partial ionization cross sections. Continuum resonances such as the ubiquitous plasmon resonances will also affect this slope. Note that extrapolation to larger PAHs is not trivial: one can expect the IE to decrease in larger PAHs due to the increasing charge stabilization by resonance, but the trend in electronic structure and continuum resonances affecting the slope is more difficult to predict. The individual slopes are plotted against the number of carbon atoms in Fig. A.3 but we cannot determine any linear relationship from our dataset. There does, however, appear to be a linear relationship between this slope and the C:H ratio (see Fig. A.4).
Given the variability seen in Fig. 4, the remarkable linear relationship found above is compatible with a uniform sharing (roughly in two halves) of the maximum available energy hv-IE between the electron and the cation. This suggests that the electron KE energy distribution is symmetric with respect to the mean value ![Mathematical equation: $\[\langle\mathrm{KE}\rangle{=}\frac{1}{2}(h\nu-\mathrm{IE})\]$](/articles/aa/full_html/2025/06/aa54245-25/aa54245-25-eq2.png) and supports the assumptions of current PE models of interstellar dust.
and supports the assumptions of current PE models of interstellar dust.
4 Astrophysical implications
In this section we exploit our PAH photoionization data to test state-of-the-art astrophysical dust photoelectric models that describe the PAH charge and gas photoelectric heating. Based on available laboratory data on small, neutral PAHs and other interstellar dust analogs, these models treat the photoelectric yield of dust grains of various sizes and charge states, thus requiring a simple and size-extrapolatable description of processes as different as photoionization (in molecules) and photoemission (in larger, solid particles). The resulting dust photoelectric model can then be used to estimate the dust charge and gas heating, which are key ingredients in simulations of star forming regions (e.g., Zhao et al. 2016). Following astrophysical terminology, we use the term photoelectric effect (PE) to refer to both processes, photoionization and photoemission, and the term “grain” to refer to large molecules, such as PAHs, but also larger particles (which can reach up to tens of nanometers in size). Current astrophysical dust photoelectric models (Bakes & Tielens 1994; Weingartner & Draine 2001; Kimura 2016) share common features. By considering dust as spherical and solid grains, they start with a photoemission formalism that is adapted to solid grains. It must be emphasized here that in photoelectric models, the electron yield is treated from a simple mean free path approach (see, e.g., Kimura 2016), whereas in molecular photoionization the electron yield is obtained by considering the competition between several relaxation channels (dissociation and radiative transitions). However, we show in the following that a photoelectric model can be successfully used to interpret ionization yield measurements on PAH molecules. Initially derived in the models of Watson (1973) and Draine (1978), the same photoelectric yield enhancement was used in Bakes & Tielens (1994, hereafter BT) and Weingartner & Draine (2001, hereafter WD) and later improved by Kimura (2016) to account for the photoelectric threshold, the energy and angular dependence of the escaping photoelectron2. The photoemission rate is then obtained from the absorption cross section of the grain, a key property in interstellar dust modeling.
The IE threshold is the next important parameter in photoelectric models. From electrostatic arguments, IE values have been extrapolated from the work function of the solid to sub-nanometer grains (or PAHs). In addition, WD accounted for the interaction between the photoelectron and the grain. Another important aspect of the gas heating is the energy partition between the grain excitation and the KE of the extracted electron. This partition is taken as the average of the electron KED, and in the following we use E2 to denote the average KE of the electron in PE models. Early work (d’Hendecourt & Leger 1987) based on limited laboratory data assumed that ![Mathematical equation: $\[E_{2}{=}\frac{1}{2}~(h\nu-\mathrm{IE})\]$](/articles/aa/full_html/2025/06/aa54245-25/aa54245-25-eq3.png) . The data presented here (see Fig. 5) support this assumption and provide a more accurate slope value, namely 0.55. This is an unexpected result but is compatible with an electron KED that is symmetric with respect to the mean value of the accessible range [0, hν − IE]. For instance, WD used a parabolic distribution for the KE of the photoelectron. We note that empirical molecular models have also been developed for PAHs, such as the Berné et al. (2022b) model. Here we aim to compare our photoionization measurements to a generic photoemission model applicable for a wide range of sizes, charge states, as well as grain material.
. The data presented here (see Fig. 5) support this assumption and provide a more accurate slope value, namely 0.55. This is an unexpected result but is compatible with an electron KED that is symmetric with respect to the mean value of the accessible range [0, hν − IE]. For instance, WD used a parabolic distribution for the KE of the photoelectron. We note that empirical molecular models have also been developed for PAHs, such as the Berné et al. (2022b) model. Here we aim to compare our photoionization measurements to a generic photoemission model applicable for a wide range of sizes, charge states, as well as grain material.
To enable comparison with models, we employed the photoionization cross sections (scaled TIY curves described in Sect. 3.3). Throughout the modeling, we used the PAH absorption cross sections from Draine & Li (2007) and the threshold IE from WD, which has been matched to an extensive database of PAHs including several ionization states. We applied the WD model with the following amendment: in the yield enhancement (see Eqs. (13) and (14) of WD), we assumed that the imaginary part of the UV index of refraction is unity, thus setting the photon attenuation length la to 10 nm at 10 eV, as in BT. As discussed below, la should be derived from the actual absorption cross section of the grain.
We now describe the extension of the Kimura (2016) results used in our PE model, which we call eK16. In the absence of specific information on the energy distribution of the photoelectron, Kimura (2016) derived a photoemission yield where the total energy of the electron produced in the grain is equal to the photon energy hv hence corresponding to the maximum KE of the electron hν − IE. In reality, in addition to the KE of the electron, the available energy hv − IE may also go into the internal energy of the grain and the interaction energy between the grain and the electron. We describe below how we accounted for these energy terms in our eK16 model. First, and following WD, we calculated the interaction energy between the electron and the grain as
![Mathematical equation: $\[E_x=-\frac{\left(Z+1+c_x\right) e^2}{a},\]$](/articles/aa/full_html/2025/06/aa54245-25/aa54245-25-eq4.png) (2)
(2)
where a is the grain radius, Z its charge in e units, and cx a correction to the pure Coulombic case that accounts for the fact that the charge in the grain is extended3. In the Kimura (2016) photoemission yield, we calculated the total energy, Et, of the electron within the grain as
![Mathematical equation: $\[E_t=E_2^i+\mathrm{IE}_x,\]$](/articles/aa/full_html/2025/06/aa54245-25/aa54245-25-eq5.png) (3)
(3)
where ![Mathematical equation: $\[E_{2}^{i}\]$](/articles/aa/full_html/2025/06/aa54245-25/aa54245-25-eq6.png) is the mean KE of the extracted electron within the grain and IEx = IE + Ex. We defined the average electron KE as
is the mean KE of the extracted electron within the grain and IEx = IE + Ex. We defined the average electron KE as
![Mathematical equation: $\[E_2=\int_{E_l}^{E_h} K ~G(K) ~\mathrm{d} K,\]$](/articles/aa/full_html/2025/06/aa54245-25/aa54245-25-eq7.png) (4)
(4)
where G(K) is the KE energy distribution of the electron and Eh = hν − IEx. In the case of a parabolic distribution with El ≥ 0, we have E2 = (Eh + El)/2. Within the grain, we have the nascent value, ![Mathematical equation: $\[E_{2}^{i}\]$](/articles/aa/full_html/2025/06/aa54245-25/aa54245-25-eq8.png) , which corresponds to El = 0 or
, which corresponds to El = 0 or ![Mathematical equation: $\[E_{2}^{i}= E_{h} / 2\]$](/articles/aa/full_html/2025/06/aa54245-25/aa54245-25-eq9.png) . In free space (like the ISM), no electric field pulls the electron far away from the grain to a detector like in a laboratory experiment. Therefore, when the grain is positively charged, the electron may fall back on the grain at the cost of the interaction energy such that El = Ex < 0. In that case E2 = Eh (Eh − 2El)/ [2(Eh − 3El)]: we used this quantity to describe the average energy released by the electron to the gas through inelastic collisions, i.e., the gas photoelectric heating. As discussed in WD, due to the interaction energy Ex the photoemission yield must be corrected at each photon energy by a factor Y2 (see Figs. 7 and 8). We note here that both
. In free space (like the ISM), no electric field pulls the electron far away from the grain to a detector like in a laboratory experiment. Therefore, when the grain is positively charged, the electron may fall back on the grain at the cost of the interaction energy such that El = Ex < 0. In that case E2 = Eh (Eh − 2El)/ [2(Eh − 3El)]: we used this quantity to describe the average energy released by the electron to the gas through inelastic collisions, i.e., the gas photoelectric heating. As discussed in WD, due to the interaction energy Ex the photoemission yield must be corrected at each photon energy by a factor Y2 (see Figs. 7 and 8). We note here that both ![Mathematical equation: $\[E_{2}^{i}\]$](/articles/aa/full_html/2025/06/aa54245-25/aa54245-25-eq10.png) and Y2 include the assumption of a parabolic G(K) with
and Y2 include the assumption of a parabolic G(K) with ![Mathematical equation: $\[E_{2}^{i}=0.5\left(h\nu-\mathrm{IE}_{x}\right)\]$](/articles/aa/full_html/2025/06/aa54245-25/aa54245-25-eq11.png) . While the present data suggest a factor of 0.55 instead of 0.5 in
. While the present data suggest a factor of 0.55 instead of 0.5 in ![Mathematical equation: $\[E_{2}^{i}\]$](/articles/aa/full_html/2025/06/aa54245-25/aa54245-25-eq12.png) , we kept the latter for a consistent estimate of Y2 and also because this choice has a small effect on the photoemission yield and gas heating (less than 10%). We also remark that the slope of Fig. 5 presents a significant dispersion as illustrated by Figs. A.3–A.4.
, we kept the latter for a consistent estimate of Y2 and also because this choice has a small effect on the photoemission yield and gas heating (less than 10%). We also remark that the slope of Fig. 5 presents a significant dispersion as illustrated by Figs. A.3–A.4.
Furthermore, the interaction of photons with nanograins cannot be described from bulk properties. We therefore refined the estimate of la by directly using the absorption cross section of the grain as follows. In a medium composed of dust grains of radius a the photon attenuation length can be expressed from the optical theorem (Kruegel 2003) as la = (ng σe)−1 where ng is the number density of grains and σe = πa2 Qe is the attenuation cross section with Qe the attenuation efficiency. For grains much smaller than the wavelength as PAHs, the attenuation is mostly due to absorption because scattering is negligible. In the case of a single grain, we have ng = 3/(4πa3) and we therefore estimated la as 4a/(3Qe). In Fig. 6 we compare the eK16 model and the WD model to our photoionization data on two PAHs selected in our sample (fluorene and perylene) to exemplify the possible effects of structure (fluorene contains a 5-ring) and size (NC = 13 for fluorene and NC = 20 for perylene). We do not include the free space yield correction due to the electron-grain interaction (the Y2 term) because in our experiment the electrons are collected thanks to a DC electric field of several hundreds of Volts/cm that will dwarf this interaction. Figures 6 and 7 show the influence of the Y2-correction, computed under the assumption of a parabolic KED of the photoelectron (see above). In other words and unlike the WD model, the photoelectric yield in laboratory data should not include the Y2 factor whereas it should be included for the photoelectric yield in free space. We believe that the role of external electric fields has been overlooked in previous comparisons of photoionization laboratory data with PE models.
We see in Fig. 6 that the WD model overestimates our data (see Sect. 3.3) and in particular (see Fig. 7) the yield derived by Wenzel et al. (2020) on singly charged PAH cations4. Conversely, the eK16 model can satisfactorily explain the data below 15 eV with cx = 0.15 suggesting that the photoelectron-grain interaction is primarily Coulombic. However, this result depends on the absorption cross section, in particular on the peak value and energy position of the strong 17 eV feature. In the model of Draine & Li (2007), this feature is strong (33 Mb/C) as taken from UV data on coronene. To study the influence of the magnitude of the 17 eV peak, we also used the absorption cross section from the PAH theory database of Malloci et al. (2011), where the 17 eV cross section is weaker (22 Mb/C, as seen in Sect. 3.3). The right column of Fig. 6 shows the ionization cross sections obtained in that case and with the eK16 yield model: we see that the agreement remains good but is affected by the structures in the theoretical absorption cross sections, which are not observed in the laboratory measurements presented here.
Finally, the yield of BT, although somewhat below eK16 (see Fig. 7), can also account for the available data. However, as discussed in Kimura (2016), the yield enhancement used in the BT model overlooks several important aspects of the photoemission of nanograins, namely the dependence of this enhancement on the photoelectric threshold (IE), as well as the energy and angular distribution of the photoelectron. The present eK16 model adds to this the account of the absorption properties of the nanograin, of the energy partition between the electron and the grain, and the electron-grain interaction. With these ingredients, the eK16 model is capable of predicting the absolute yield of a sample of PAHs (and possibly larger species as more data become available), a remarkable result that motivates the use of the eK16 model to describe the grain charge and the PE on interstellar dust. The eK16 photoelectric model has been implemented in the DustEM code5, allowing for dust charge and heating estimates in a variety of astrophysical conditions.
As mentioned earlier, dust photoelectric heating plays an important role in the thermal budget of irradiated interstellar clouds. This process depends on the charge state of the grain, which is set by the PE but also by the sticking or recombination of charged gas species (such as e−, H+, and C+) on the grain. Recombination also cools the gas because it collects species carrying thermal energy. We assessed the impact of our photo-electric model by looking at the photoelectric energy efficiency in the absence of recombination, whereby we calculated the maximum photoelectric efficiency as
![Mathematical equation: $\[\epsilon_{\mathrm{PE}}=\frac{\int_{\mathrm{IE}}^{13.6 e V} I_E \sigma_E ~Y_{\mathrm{PE}} Y_2 \frac{E_2}{E} \mathrm{~d} E}{\int_0^{13.6 e V} I_E \sigma_E \mathrm{d} E},\]$](/articles/aa/full_html/2025/06/aa54245-25/aa54245-25-eq13.png) (5)
(5)
where we included (as in WD) the effect of the electron-grain interaction on the yield (Y2 term) and on the energy E2 of the escaping photoelectron. The radiation field, IE, in erg/cm2/s/eV/sr is the standard interstellar standard radiation field from Mathis et al. (1983).
Figure 8 shows ϵPE in the case of perylene, the largest molecule in our sample with an equivalent spherical radius of 0.35 nm. For this small size, we find that we recover the result of WD (Fig. 12 of their paper). Next, the efficiency decreases across the models (BT, WD, and eK16) mostly because the yield drops (see the bottom panel of Fig. 8) but also because of the stronger 17 eV peak adopted in the WD model. We emphasize that the BT model does not take into account the electron-grain interaction Ex for the yield (Y2 factor) or the electron energy (E2). The latter effect is illustrated in Fig. 8. In the case of the eK16 model – which best reproduces the present data, including the PAH cations (Wenzel et al. 2020) – the maximum photoelectric efficiency we find, ϵPE ~ 1.5%, is significantly lower than that of former models, for which this efficiency was 2%. For the case of perylene, this value corresponds to a perylene photoelectric rate of 2.3 × 10⁻²⁰ erg/s per carbon atom or 2 × 10⁻²⁶ erg/s per H atom if 10% of cosmic C is in PAHs ([C/H]PAH = 5×10⁻⁵). Considering the fact that ϵPE increases with size (Fig. 12 of Weingartner & Draine 2001), this value suggests that the thermal budget of the diffuse ISM6 can be reached (9.5×10⁻²⁶ erg/s/H, Gerin et al. 2015).
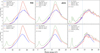 |
Fig. 6 Models (solid red lines) of our data on the photoionization cross section of fluorene and perylene (solid blue lines, scaled to 22 Mb/C at the 17 eV peak). The left column shows the WD model and the middle one the eK16 model, both of which use the astronomical PAH absorption cross sections from Draine & Li (2007, dashed green lines). The dotted red lines show cross sections in free space, i.e., including the Y2 correction (see WD). As discussed in the text, this correction does not apply to our data. To illustrate the impact of the absorption cross section choice, the right column shows an eK16 model in which the absorption has been taken from the PAH theory database (https://www.dsf.unica.it/gmalloci/pahs/pahs.html). The dotted red lines in this column show the ionization cross section obtained while using the yield from Jochims et al. (1996). For all the eK16 models in this figure, we have set cx to 0.15. The vertical dotted black line shows the Lyman α limit at 13.6 eV, the photon energy upper limit in neutral astrophysical media. |
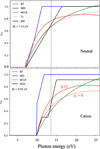 |
Fig. 7 Photoelectric yields of models WD, eK16, and BT. Top panel: case of the neutral perylene (NC = 20). The empirical yield from Jochims et al. (1996, solid black line) is overlaid. The dotted red line shows the Y2 correction for free space (WD), which is not applied here. Bottom panel: case of a singly charged PAH cation NC = 40. The solid black line shows the yield derived by Wenzel et al. (2020) from a sample of large PAHs cations. The dotted red line shows the impact of changing cx. |
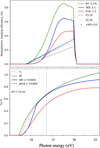 |
Fig. 8 Case of perylene in the interstellar standard radiation field. Top: Maximum photoelectric efficiency (in %) for the BT, WD, and eK16 models as a function of the photon energy. The integrated value ϵPE is given in the legend. In dotted lines, we show E2, the average KE of the photoelectron, uncorrected for the interaction with the grain (in gray) and corrected for this interaction (in black). The WD and eK16 curves use the corrected E2. Bottom: Full yield for the three models, including the correction due to the electron-grain interaction with cx = 0.15. |
5 Conclusions
In this work, we recorded the 2D photoelectron spectrum matrices of nine PAHs that contain 13–20 carbon atoms and embody different shapes, some including pentagons or an attached aliphatic group, to explore the effect of a diversity of molecular structures on the spectra and to analyze their photoionization characteristics of relevance to the photoelectric heating of interstellar gas. To accompany the matrices, we have presented 1D projections that include the TPES, the electron KED, and the TIYs. We have shown that despite the PAHs ranging in size and symmetries, their overall photoionization behavior can be parametrized with the general scaling law (see Fig. 5). Additionally, the collective TIY curves are very similar in appearance and can be scaled to provide a photoionization cross section consistent with previous measurements as well as with theoretically calculated absorption cross sections and photoionization quantum yields.
Comparing the PAH photoionization data with photoelectric models of interstellar dust, we find that the eK16 model, extended here to take into account the KED of the photoelectron and its interaction with the grain, closely reproduces the data presented on neutral and cationic small PAHs. Unlike former models, the photoelectric yield of this extended model is determined directly without any scaling to laboratory data and, as the grain size increases, merges smoothly with the semiclassical threshold function (Kimura 2016). The eK16 model predicts a lower (by 25%) maximum gas heating efficiency (ϵPE ~ 1.5%) than the WD model. This difference is mostly due to the electron–grain interaction that should be applied in free space only and not in the case of laboratory experiments. This implies a cooler gas temperature in irradiated interstellar regions, a key parameter for the description of gas emission and evolution.
Data availability
All the data presented in this article are published in https://doi.org/10.5281/zenodo.15271348
Acknowledgements
This work benefitted from access to the SOLEIL synchrotron under propsal number 20170934. We are grateful to their staff for smoothly running the facility. LV gratefully acknowledges Franck Le Petit for mentioning the Kimura paper to him at the time.
Appendix A Integrated electron kinetic energy releases
To arrive at the linear law presented in Fig. 5 and described in Sect. 3.4, electron KEDs can be obtained by summing the distributions at all available photon energies. This is shown in Figs. A.1 and A.2 for a flat radiation field and the Lyman-α line, respectively.
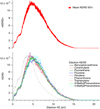 |
Fig. A.1 Bottom panel: eKER for the nine species under consideration. Top panel: Mean eKER and the standard deviation calculated for a 95% confidence level. Note that the phenanthrene data were not used to obtain the mean eKER for the reasons outlined in the main text. |
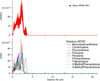 |
Fig. A.2 eKER obtained at the Ly-α photon energy. Bottom panel: Results for the nine species under consideration. Top panel: Mean eKER and the standard deviation calculated for a 95% confidence level. |
There is a bit of variability in the average slope 0.55. It would be tempting to assume a linear relationship with the PAH size; however, as shown in Fig. A.3, no such relationship can be conclusively observed in our dataset. However, there appears to be a non-negligible, albeit small, linear relationship when plotted against the C:H ratio of the PAHs (Fig. A.4). This indicates that there might be a relationship between the total electron kinetic energy release (eKER) slopes and the C:H ratios of PAHs. Since our sample size of PAHs is rather small, we do not draw any concrete conclusions from our dataset on this point.
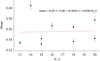 |
Fig. A.3 Slopes of the linear law of the linear eKER of the individual PAHs plotted against the number of carbon atoms, NC. |
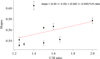 |
Fig. A.4 Slopes of the linear law of the linear eKER of the individual PAHs plotted against the ratio between carbon and hydrogen atoms. |
All the data presented in this article are published in the Zenodo database under the DOI: 10.5281/zenodo.15271348
References
- Allamandola, L. J., Tielens, A. G. G. M., & Barker, J. R. 1985, ApJ, 290, L25 [Google Scholar]
- Baer, T., & Tuckett, R. P. 2017, Phys. Chem. Chem. Phys., 19, 9698 [NASA ADS] [CrossRef] [Google Scholar]
- Bagdia, C., Bhogale, A., Gulyas, L., & Tribedi, L. C. 2021, Phys. Rev. A, 104, L060802 [Google Scholar]
- Bakes, E., & Tielens, A. G. G. M. 1994, ApJ, 427, 822 [NASA ADS] [CrossRef] [Google Scholar]
- Bernadotte, S., Evers, F., & Jacob, C. R. 2013, J. Phys. Chem. C, 117, 1863 [Google Scholar]
- Berné, O., Habart, É., Peeters, E., et al. 2022a, PASP, 134, 054301 [CrossRef] [Google Scholar]
- Berné, O., Foschino, S., Jalabert, F., & Joblin, C. 2022b, A&A, 667, A159 [NASA ADS] [CrossRef] [EDP Sciences] [Google Scholar]
- Bouwman, J., Sztáray, B., Oomens, J., Hemberger, P., & Bodi, A. 2015, J. Phys. Chem. A., 119, 1127 [Google Scholar]
- Bouwman, J., Hrodmarsson, H. R., Ellison, G. B., Bodi, A., & Hemberger, P. 2021, J. Phys. Chem. A., 125, 1738 [Google Scholar]
- Bréchignac, P., Garcia, G. A., Falvo, C., et al. 2014, J. Chem. Phys., 141, 164325 [CrossRef] [Google Scholar]
- Bull, J. N., Bolognesi, P., Anstöter, C. S., et al. 2023, J. Chem. Phys., 158, 241101 [Google Scholar]
- Chapkin, K. D., Bursi, L., Clark, B. D., et al. 2020, J. Phys. Chem. C, 124, 20450 [Google Scholar]
- d’Hendecourt, L. B., & Leger, A. 1987, A&A, 180, L9 [Google Scholar]
- Dougherty, R. C., Bertorello, H. E., & De Bertorello, M. M. 1971, OMS, 5, 1321 [Google Scholar]
- Douix, S., Duflot, D., Cubaynes, D., Bizau, J.-M., & Giuliani, A. 2017, J. Phys. Chem. Lett., 8, 7 [Google Scholar]
- Draine, B. 1978, ApJSS, 36, 595 [Google Scholar]
- Draine, B. T., & Li, A. 2007, ApJ, 657, 810 [CrossRef] [Google Scholar]
- Ekern, S. P., Marshall, A. G., Szczepanski, J., & Vala, M. 1998, J. Phys. Chem. A, 102, 3498 [NASA ADS] [CrossRef] [Google Scholar]
- Garcia, G. A., Nahon, L., & Powis, I. 2004, Rev. Sci. Instrum., 75, 4989 [Google Scholar]
- Garcia, G. A., de Miranda, B. K. C., Tia, M., Daly, S., & Nahon, L. 2013, Rev. Sci. Instrum., 84 [Google Scholar]
- Gerin, M., Ruaud, M., Goicoechea, J. R., et al. 2015, A&A, 573, A30 [NASA ADS] [CrossRef] [EDP Sciences] [Google Scholar]
- Gotkis, Y., Oleinikova, M., Naor, M., & Lifshitz, C. 1993, J. Phys. Chem., 97, 12282 [Google Scholar]
- Habart, E., Verstraete, L., Boulanger, F., et al. 2001, A&A, 373, 702 [NASA ADS] [CrossRef] [EDP Sciences] [Google Scholar]
- Hrodmarsson, H. R., Garcia, G. A., Linnartz, H., & Nahon, L. 2020, Phys. Chem. Chem. Phys., 22, 13880 [Google Scholar]
- Hrodmarsson, H. R., Aleman, I., Candian, A., et al. 2025, Space Sci. Rev., 221, 42 [Google Scholar]
- Hush, N., Cheung, A., & Hilton, P. 1975, J. Electron Spectros. Relat. Phenomena, 7, 385 [Google Scholar]
- Joblin, C., Dontot, L., Garcia, G. A., et al. 2017, J. Phys. Chem. Lett., 8, 3697 [NASA ADS] [CrossRef] [Google Scholar]
- Jochims, H., Ruhl, E., Baumgartel, H., Tobita, S., & Leach, S. 1994, ApJ, 420, 307 [Google Scholar]
- Jochims, H. W., Baumgartel, H., & Lench, S. 1996, A&A, 314, 1003 [NASA ADS] [Google Scholar]
- Jochims, H. W., Ruhl, E., Baumgartel, H., Tobita, S., & Leach, S. 1997, Int. J. Mass Spectrom., 167, 35 [Google Scholar]
- Jochims, H. W., Baumgärtel, H., & Leach, S. 1999, ApJ, 512, 500 [NASA ADS] [CrossRef] [Google Scholar]
- Johansson, K. O., Campbell, M. F., Elvati, P., et al. 2017a, J. Phys. Chem. A., 121, 4447 [Google Scholar]
- Johansson, K. O., Zador, J., Elvati, P., et al. 2017b, J. Phys. Chem. A, 121, 4475 [Google Scholar]
- Kadhane, U. R., Vinitha, M. V., Ramanathan, K., et al. 2022, J. Chem. Phys., 156, 244304 [Google Scholar]
- Keller, J., & Coplan, M. 1992, Chem. Phys. Lett., 193, 89 [Google Scholar]
- Keller, J., Coplan, M., & Goruganthu, R. 1992, ApJ, 391, 872 [Google Scholar]
- Kimura, H. 2016, MNRAS, 459, 2751 [NASA ADS] [CrossRef] [Google Scholar]
- Kruegel, E. 2003, The physics of interstellar dust (Boca Raton: CRC Press) [CrossRef] [Google Scholar]
- Leach, S., Jochimsa, H.-W., Baumgartel, H., & Champion, N. 2018, ZPC, 232, 845 [Google Scholar]
- Leger, A., & Puget, J. 1984, A&A, 137, L5 [NASA ADS] [Google Scholar]
- Li, A. 2020, Nat. Astron., 4, 339 [CrossRef] [Google Scholar]
- Lifshitz, C. 1982, Mass Spectrom. Rev., 1, 309 [Google Scholar]
- Maier, J., & Turner, D. 1972, Faraday Discuss., 54, 149 [Google Scholar]
- Malloci, G., Cappellini, G., Mulas, G., & Mattoni, A. 2011, Chem. Phys., 385, 19 [Google Scholar]
- Manjavacas, A., Marchesin, F., Thongrattanasiri, S., et al. 2013, ACS Nano, 7, 3635 [Google Scholar]
- Marciniak, A., Joblin, C., Mulas, G., Mundlapati, V. R., & Bonnamy, A. 2021, A&A, 652, A42 [NASA ADS] [CrossRef] [EDP Sciences] [Google Scholar]
- Mathis, J. S., Mezger, P. G., & Panagia, N. 1983, A&A, 128, 212 [NASA ADS] [Google Scholar]
- Mayer, P. M., & Bodi, A. 2021, J. Mol. Spectr., 377, 111446 [Google Scholar]
- Nahon, L., de Oliveira, N., Garcia, G. A., et al. 2012, J. Synchrotron Radiat., 19, 508 [CrossRef] [PubMed] [Google Scholar]
- Nounou, P. 1966, J. Chim. Phys., 63, 994 [Google Scholar]
- Ohno, K. 1979, Chem. Phys., 37, 63 [Google Scholar]
- Poully, J. C., Schermann, J. P., Nieuwjaer, N., et al. 2010, Phys. Chem. Chem. Phys., 12, 3566 [CrossRef] [Google Scholar]
- Ramanathan, K., S., A., Bouwman, J., et al. 2022, J. Chem. Phys., 157, 064303 [Google Scholar]
- Rapp, U., Staab, H. A., & Wünsche, C. 1970, OMS, 3, 45 [Google Scholar]
- Rouillé, G., Krasnokutski, S. A., Fulvio, D., et al. 2015, ApJ, 810, 114 [Google Scholar]
- Rouillé, G., Steglich, M., Hemberger, P., Jäger, C., & Henning, T. 2019, ApJ, 885, 21 [Google Scholar]
- Roy Chowdhury, M., Garcia, G. A., Hrodmarsson, H. R., Loison, J.-C., & Nahon, L. 2024, ApJ, 963, 29 [Google Scholar]
- Schleier, D., Hemberger, P., Bodi, A., & Bouwman, J. 2022, J. Phys. Chem. A, 126, 2211 [Google Scholar]
- Schmidt, W. 1977, J. Chem. Phys., 66, 828 [Google Scholar]
- Schröder, D., Loos, J., Schwarz, H., et al. 2001, Helv. Chim. Acta, 84, 1625 [Google Scholar]
- Sundararajan, P., Candian, A., Kamer, J., Linnartz, H., & Tielens, A. G. G. M. 2024, Phys. Chem. Chem. Phys., 26, 19332 [Google Scholar]
- Tang, X., Garcia, G. A., Gil, J.-F., & Nahon, L. 2015, Rev. Sci. Instrum., 86 [Google Scholar]
- Tia, M., de Miranda, B. C., Daly, S., et al. 2013, J. Phys. Chem. Lett., 4, 2698 [Google Scholar]
- Tielens, A. G. G. M., & Hollenbach, D. 1985, ApJ, 291, 722 [Google Scholar]
- Tobita, S., Leach, S., Jochims, H., et al. 1994, Can. J. Phys., 72, 1060 [Google Scholar]
- Verstraete, L., Leger, A., d’Hendecourt, L., Dutuit, O., & Defourneau, D. 1990, A&A, 237, 436 [NASA ADS] [Google Scholar]
- Watson, W. D. 1973, J. Opt. Soc. Am., 63, 164 [Google Scholar]
- Weingartner, J. C., & Draine, B. T. 2001, ApJSS, 134, 263 [Google Scholar]
- Wenzel, G., Joblin, C., Giuliani, A., et al. 2020, A&A, 641, A98 [NASA ADS] [CrossRef] [EDP Sciences] [Google Scholar]
- West, B., Joblin, C., Blanchet, V., et al. 2014a, J. Phys. Chem. A., 118, 1807 [Google Scholar]
- West, B., Useli-Bacchitta, F., Sabbah, H., et al. 2014b, J. Phys. Chem. A., 118, 7824 [Google Scholar]
- West, B. J., Lesniak, L., & Mayer, P. M. 2019, J. Phys. Chem. A, 123, 3569 [NASA ADS] [CrossRef] [Google Scholar]
- Zhao, B., Caselli, P., Li, Z.-Y., et al. 2016, MNRAS, 460, 2050 [Google Scholar]
- Zhen, J., Castellanos, P., Paardekooper, D. M., et al. 2015, ApJ, 804, L7 [Google Scholar]
- Zhen, J., Castillo, S. R., Joblin, C., et al. 2016, ApJ, 822, 113 [Google Scholar]
This resonance, well known in solid state physics, can also be identified in other molecular systems (Bernadotte et al. 2013).
We also note that in the case of sub-nanometer grains, the yield enhancement of Draine (1978) decreases as the mean free path of electrons increases (see Eq. (17) of BT), whereas the reverse is expected. This problem is settled in the Kimura (2016) yield.
This term involves the grain polarizability and may thus depend on grain size and shape.
This comparison to the Wenzel et al. (2020) data only uses their analytical formula for the yield, but our model goes well into the data dispersion shown in their Fig. 8.
Accessible here https://www.ias.u-psud.fr/DUSTEM/
Which has a temperature of 100 K for a proton density of 50 per cm3.
All Tables
All Figures
|
Fig. 1 From top to bottom: 2D photoelectron spectrum matrix matrices, threshold photoelectron spectra, electron kinetic energy, and TIYs for (from left to right) benzo[c]phenanthrene, triphenylene, and corannulene. |
| In the text | |
|
Fig. 2 Same as Fig. 1 but for (from left to right) 3-methylphenanthrene, 4-methylphenanthrene, and phenanthrene. |
| In the text | |
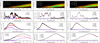 |
Fig. 3 Same as Fig. 1 but for (from left to right) fluorene, perylene, and fluoranthene. |
| In the text | |
|
Fig. 4 Panel a: comparison of the ionization cross sections for some of the molecules studied (see the legend). All cross sections have been scaled to 22 Mb/C on the 17 eV peak. Panel b: average of the cross sections shown above. There is a clear a linear increase from 10 to 17 eV, as already noted in Johansson et al. (2017a). |
| In the text | |
|
Fig. 5 Mean KE, ⟨KE⟩, of the extracted photoelectrons for the nine PAHs of our sample and for all photon energies, hν (colored curves). The solid black line shows that a linear fit of slope 0.55 is a good representation of the relationship between ⟨KE⟩ and hv. |
| In the text | |
|
Fig. 6 Models (solid red lines) of our data on the photoionization cross section of fluorene and perylene (solid blue lines, scaled to 22 Mb/C at the 17 eV peak). The left column shows the WD model and the middle one the eK16 model, both of which use the astronomical PAH absorption cross sections from Draine & Li (2007, dashed green lines). The dotted red lines show cross sections in free space, i.e., including the Y2 correction (see WD). As discussed in the text, this correction does not apply to our data. To illustrate the impact of the absorption cross section choice, the right column shows an eK16 model in which the absorption has been taken from the PAH theory database (https://www.dsf.unica.it/gmalloci/pahs/pahs.html). The dotted red lines in this column show the ionization cross section obtained while using the yield from Jochims et al. (1996). For all the eK16 models in this figure, we have set cx to 0.15. The vertical dotted black line shows the Lyman α limit at 13.6 eV, the photon energy upper limit in neutral astrophysical media. |
| In the text | |
|
Fig. 7 Photoelectric yields of models WD, eK16, and BT. Top panel: case of the neutral perylene (NC = 20). The empirical yield from Jochims et al. (1996, solid black line) is overlaid. The dotted red line shows the Y2 correction for free space (WD), which is not applied here. Bottom panel: case of a singly charged PAH cation NC = 40. The solid black line shows the yield derived by Wenzel et al. (2020) from a sample of large PAHs cations. The dotted red line shows the impact of changing cx. |
| In the text | |
|
Fig. 8 Case of perylene in the interstellar standard radiation field. Top: Maximum photoelectric efficiency (in %) for the BT, WD, and eK16 models as a function of the photon energy. The integrated value ϵPE is given in the legend. In dotted lines, we show E2, the average KE of the photoelectron, uncorrected for the interaction with the grain (in gray) and corrected for this interaction (in black). The WD and eK16 curves use the corrected E2. Bottom: Full yield for the three models, including the correction due to the electron-grain interaction with cx = 0.15. |
| In the text | |
|
Fig. A.1 Bottom panel: eKER for the nine species under consideration. Top panel: Mean eKER and the standard deviation calculated for a 95% confidence level. Note that the phenanthrene data were not used to obtain the mean eKER for the reasons outlined in the main text. |
| In the text | |
|
Fig. A.2 eKER obtained at the Ly-α photon energy. Bottom panel: Results for the nine species under consideration. Top panel: Mean eKER and the standard deviation calculated for a 95% confidence level. |
| In the text | |
|
Fig. A.3 Slopes of the linear law of the linear eKER of the individual PAHs plotted against the number of carbon atoms, NC. |
| In the text | |
|
Fig. A.4 Slopes of the linear law of the linear eKER of the individual PAHs plotted against the ratio between carbon and hydrogen atoms. |
| In the text | |
Current usage metrics show cumulative count of Article Views (full-text article views including HTML views, PDF and ePub downloads, according to the available data) and Abstracts Views on Vision4Press platform.
Data correspond to usage on the plateform after 2015. The current usage metrics is available 48-96 hours after online publication and is updated daily on week days.
Initial download of the metrics may take a while.