Open Access
Fig. A.1
Download original image
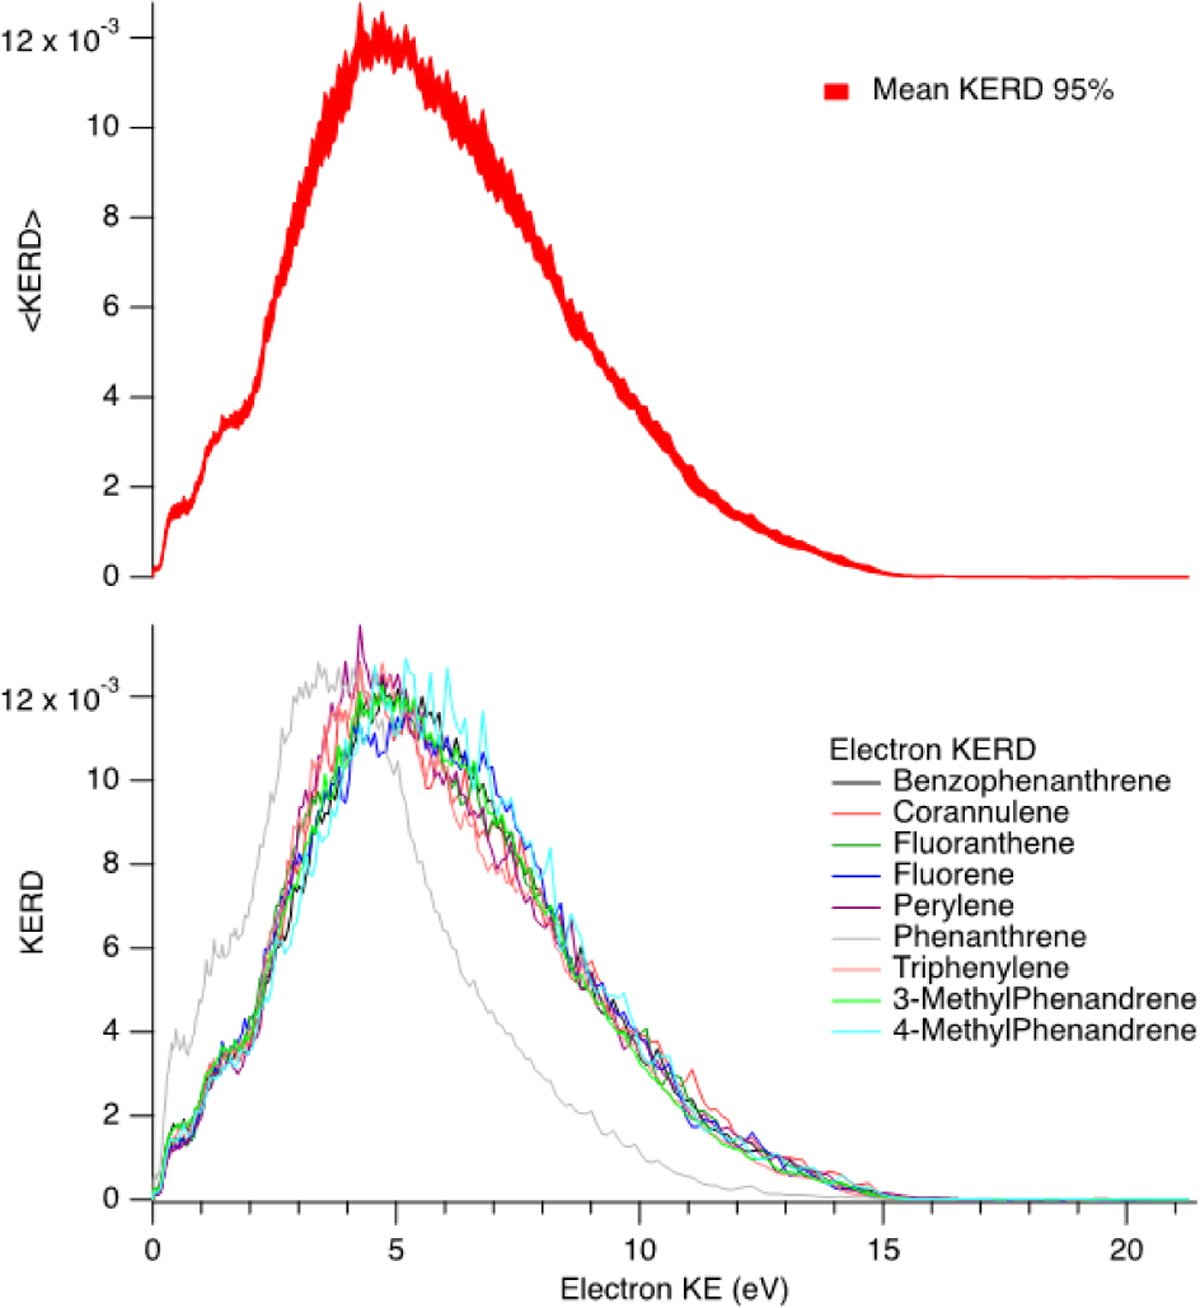
Bottom panel: eKER for the nine species under consideration. Top panel: Mean eKER and the standard deviation calculated for a 95% confidence level. Note that the phenanthrene data were not used to obtain the mean eKER for the reasons outlined in the main text.
Current usage metrics show cumulative count of Article Views (full-text article views including HTML views, PDF and ePub downloads, according to the available data) and Abstracts Views on Vision4Press platform.
Data correspond to usage on the plateform after 2015. The current usage metrics is available 48-96 hours after online publication and is updated daily on week days.
Initial download of the metrics may take a while.