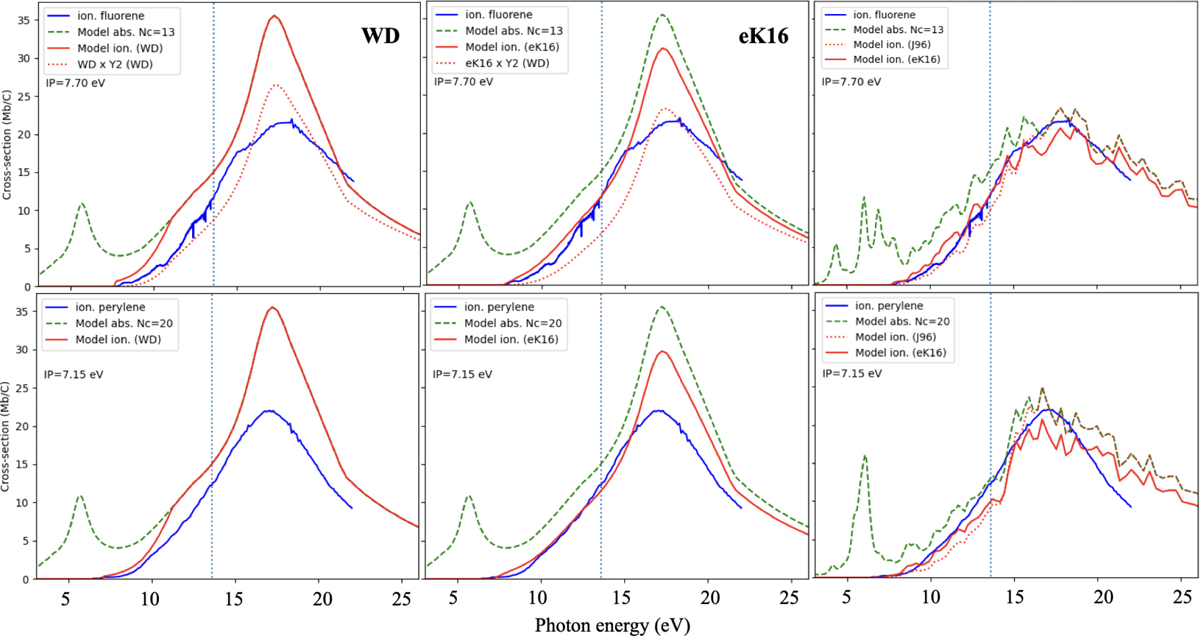
Fig. 6
Download original image
Models (solid red lines) of our data on the photoionization cross section of fluorene and perylene (solid blue lines, scaled to 22 Mb/C at the 17 eV peak). The left column shows the WD model and the middle one the eK16 model, both of which use the astronomical PAH absorption cross sections from Draine & Li (2007, dashed green lines). The dotted red lines show cross sections in free space, i.e., including the Y2 correction (see WD). As discussed in the text, this correction does not apply to our data. To illustrate the impact of the absorption cross section choice, the right column shows an eK16 model in which the absorption has been taken from the PAH theory database (https://www.dsf.unica.it/gmalloci/pahs/pahs.html). The dotted red lines in this column show the ionization cross section obtained while using the yield from Jochims et al. (1996). For all the eK16 models in this figure, we have set cx to 0.15. The vertical dotted black line shows the Lyman α limit at 13.6 eV, the photon energy upper limit in neutral astrophysical media.
Current usage metrics show cumulative count of Article Views (full-text article views including HTML views, PDF and ePub downloads, according to the available data) and Abstracts Views on Vision4Press platform.
Data correspond to usage on the plateform after 2015. The current usage metrics is available 48-96 hours after online publication and is updated daily on week days.
Initial download of the metrics may take a while.