| Issue |
A&A
Volume 698, June 2025
|
|
|---|---|---|
| Article Number | A249 | |
| Number of page(s) | 11 | |
| Section | Astronomical instrumentation | |
| DOI | https://doi.org/10.1051/0004-6361/202554218 | |
| Published online | 17 June 2025 | |
High-resolution, high-efficiency narrowband spectroscopy with an s-p-phased holographic grating in double pass
1
Département d’Astronomie de l’Université de Genève,
Chemin Pegasi 51b,
1290
Versoix,
Switzerland
2
School of Mathematical and Physical Sciences, Macquarie University,
Balaclava Road,
North Ryde,
NSW
2109,
Australia
3
Wasatch Photonics,
1305 North 1000 West, Suite 120,
Logan,
UT
84321,
USA
★ Corresponding author: This email address is being protected from spambots. You need JavaScript enabled to view it.
Received:
21
February
2025
Accepted:
15
May
2025
Abstract
Context. High-resolution spectroscopy (R>50 000) in astronomy is typically performed with echelle-type spectrographs. The science for which these instruments have proven very effective is the detection of exoplanets through the radial velocity method, and the characterization of their atmospheres. For atmospheric characterization, it has been proven tedious to detect these signals, however mostly due to sensitivity constraints. While echelle-type spectrographs provide the necessary broad bandwidth for radial velocity measurements, they compromise total throughput. Additionally, the need for spectral order sorting complicates the optical design and reduces throughput further. A high spectral resolution and a limited bandpass are required to measure the exoplanet atmospheric absorption from the ground. Therefore, we propose a new method to for achieving a very high spectral resolution with significantly higher throughput within a limited bandpass that is focused on a specific spectral line or set of spectral lines of interest.
Aims. We describe and test a novel method for reaching a high spectral resolution with very high unpolarized diffraction efficiency in first-order employing a tuned high fringe-density volume-phase holographic (VPH) grating in double pass. We also provide laboratory tests that highlight the potential of this setup.
Methods. We used a wavelength-tunable laser to measure the dispersion and diffraction efficiency of a tuned VPH grating. We compared a single- and double-pass setup to verify the expected results. We also imaged the resulting spectrum to assess the optical quality.
Results. The VPH grating we tested can reach a diffraction-limited resolving power of >140 000 in double pass, with a peak double-pass diffraction efficiency of 79% for unpolarized light. We tested the grating at a more modest resolution of 38 000 given the sampling constraints. Based on current manufacturing abilities, we estimate that double-pass diffraction efficiencies over 50% with diffraction-limited resolving powers >200 000 should be within reach from the visible to the near-infrared, where the bandwidth is limited by the detector size.
Conclusions. For specific science cases where a relatively narrow wavelength regime at (ultra-)high spectral resolution is required, a double-pass VPH setup can prove to be very efficient. As the grating operates in first order, there is no need for a cross-dispersion, which allows very high total system throughputs and less complicated optics overall. This might enable ground-breaking science with smaller-class telescopes, with relatively compact instruments, and it might be of special interest for exoplanet atmospheric characterization because these observations typically require a large amount of observing time, a high signal-to-noise ratio, and a high spectral resolution.
Key words: instrumentation: spectrographs / techniques: spectroscopic / planets and satellites: atmospheres / infrared: planetary systems
© The Authors 2025
 Open Access article, published by EDP Sciences, under the terms of the Creative Commons Attribution License (https://creativecommons.org/licenses/by/4.0), which permits unrestricted use, distribution, and reproduction in any medium, provided the original work is properly cited.
This article is published in open access under the Subscribe to Open model. This email address is being protected from spambots. You need JavaScript enabled to view it. to support open access publication.
1 Introduction
High-resolution spectroscopy (R>50 000) in astronomy is typically performed with cross-dispersed echelle spectrographs for the UV to near-infrared (near-IR) regime. First described by Nagaoka & Mishima (1923), well-known instruments are, for example, the Space Telescope Imaging Spectrograph (STIS) on the Hubble Space Telescope (Woodgate et al. 1998), the CRyogenic high-resolution InfraRed Echelle Spectrograph (CRIRES) and the Echelle SPectrograph for Rocky Exoplanets and Stable Spectroscopic Observations (ESPRESSO) on the Very Large Telescope (Kaeufl et al. 2004; Pepe et al. 2010), and the High Resolution Echelle Spectrometer (HIRES) on Keck (Vogt et al. 1994). Echelle spectrographs combine a low groove density and high spectral order because the maximum (diffraction-limited) spectral resolving power R is given by the spectral order M, multiplied by the number of illuminated grating lines N (Eq. (1)),
![Mathematical equation: $\[R=M \times N.\]$](/articles/aa/full_html/2025/06/aa54218-25/aa54218-25-eq1.png) (1)
(1)
R thus depends on the size of the incident beam falling on the grating and its angle of incidence (AOI). The total optical path difference imposed by the grating is relevant here.
The groove density, spectral order(s), and resolving power are typically matched to satisfy the instrument requirements. Another important factor to consider here is the free spectral range (FSR). The FSR of a single order Mi is defined as the spectral distance from its maximum-intensity peak to the peak of the adjacent order Mi±1 and is given by
![Mathematical equation: $\[\mathrm{FSR}_i=\frac{\lambda}{M_i}.\]$](/articles/aa/full_html/2025/06/aa54218-25/aa54218-25-eq2.png) (2)
(2)
Typically, at high orders (M>20), some method is required to split these spatially overlapping orders to cover a broad wavelength range (e.g., the full visible regime, 380 nm < λ < 750 nm). To do this, a cross-disperser is typically introduced. This is a secondary dispersive element, such as a grating or prism, with a dispersion axis perpendicular to the dispersion axis of the echelle to separate overlapping orders (Nagaoka & Mishima 1923). As an echelle setup relies on additional optics to separate overlapping spectral orders, the total throughput of the system decreases and overall complexity increases. Because echelle gratings are mechanically ruled, they are also prone to manufacturing errors. For example, they can produce significant amounts of stray light because of random errors on the grating surface, and optical ghosts as a result of periodic ruling errors are a problem (Gao et al. 2021). Large echelle gratings are also challenging to manufacture, and hence, commercial options are limited.
A different type of grating that has gained popularity in astronomical instrumentation is the volume-phase holographic (VPH) grating (Barden et al. 1998; Arns et al. 1999). These immersed gratings have become popular because they:
are easily tunable in groove density, size, and glass type for specific applications.
They also provide very high first-order diffraction efficiencies.
They barely show periodic or random errors, which eliminates ghosts and greatly reduces scattered light.
Finally, they are well protected because they are immersed between two glass plates, allowing for easy handling and cleaning.
In a direct comparison, VPH gratings typically surpass echelle gratings in terms of efficiency, scattered light performance, and spectral resolution (Kielkopf 1981; Farret Jentink et al. 2023). VPH gratings generally operate in first order. Based on Eq. (1), a greater number of illuminated lines on the grating are required to achieve a high spectral resolution to match the resolutions provided by echelle gratings. Through their manufacturing process, VPH gratings can accommodate this need because they can be produced with up to >6000 lines/mm (Barden et al. 1998). This significantly exceeds the line densities of typical echelle gratings.
As the groove density increases, however, the angle of incidence (AOI) required to achieve maximum efficiency in the first spectral order changes as well. At very high groove densities, where the AOI exceeds 36°, VPH gratings become significantly less efficient for light in the s-polarized state (Baldry et al. 2004). For the remainder of this paper, we adopt the definition in which the s-polarization has an electric vector that is perpendicular to the grating lines, similar to Baldry et al. (2004).
For measurements of unpolarized light, which are common in astronomy, the efficiency advantages of VPH gratings can be less apparent when compared to echelle gratings in configurations with a high spectral resolution. To achieve a high first-order diffraction efficiency for unpolarized light at high groove densities, however, the grating thickness and refractive index modulation can be optimized to align the efficiency curves of s- and p-polarized light within a narrow wavelength range. This technique was initially described by Dickson et al. (1994), and these specially optimized VPH gratings are often referred to as Dickson gratings.
To achieve a very high spectral resolution while maintaining high throughput, a new instrument named NIGHT (Farret Jentink et al. 2023) will use this type of grating in a double-pass configuration. As part of the development program for this instrument, we present (to our knowledge for the first time) a high-efficiency diffraction-limited experimental setup employing a single Dickson grating in a double-pass arrangement. We also compare our experimental results with theoretical predictions, and we briefly discuss the potential applications of this technology in astronomical instrumentation.
2 Theory
2.1 VPH gratings
All diffraction gratings operate in notably similar manners. When light strikes a grating at a specific angle of incidence α, it creates a phase delay as it reflects off or passes through various grooves, fringes, or lines comprising the grating at different locations. Consequently, the resulting wavefronts positively interfere at distinct wavelengths for various angular deviations in the outgoing beam. This leads to the reflection or transmission of different wavelengths at different angles. The mathematical description of the interference of wavefronts leads to the grating equation (e.g., Gover et al. 2005):
![Mathematical equation: $\[m \rho \lambda=n_1(\sin~ \alpha+\sin~ \beta),\]$](/articles/aa/full_html/2025/06/aa54218-25/aa54218-25-eq3.png) (3)
(3)
for spectral order m, line-density ρ, wavelength λ, incidence angle α, and diffraction angle β. Gover et al. (2005) also showed that the derivative of this equation leads to the well-known equation of angular dispersion,
![Mathematical equation: $\[\frac{\mathrm{d} \beta}{\mathrm{~d} \lambda}=\frac{m \cdot \rho}{\cos~ \beta},\]$](/articles/aa/full_html/2025/06/aa54218-25/aa54218-25-eq4.png) (4)
(4)
assuming the grating resides in vacuum and n1 = 1. After we described the basics of grating theory, we consider VPH gratings in particular. Arns (1995) and Barden et al. (1998) described the basic principles of VPH gratings and showed their potential for usage in astronomical spectrographs. A basic diagram of a VPH grating can be found in Fig. 1. A VPH is in essence built up of three layers. A central layer of dichromated material, typically dichromated gelatin (DCG), is merged between two plane glass substrates (Shankoff 1968; Barden et al. 2000; Baldry et al. 2004). The DCG layer has a varying refractive index that acts as fringes on which incoming light can reflect. DCG has a refractive index of ~1.5, and the index modulation can be tuned to values between 0.02 and 0.10 (Barden et al. 2000). This modulation can typically be described by a sinusoidal variation and is applied to the DCG by holographic illumination with a wave pattern produced by fringes from a laser source interference pattern (Barden et al. 2000). This way of production allows for great flexibility in the manufacturing process. We list some examples of VPH gratings in high-resolution astronomical spectrographs with their respective properties and resolving powers in Table 1. Some existing spectrographs achieve a very high resolving power, for example, the HERMES instrument (Sheinis et al. 2014). It is important to note, however, that HERMES is only sensitive in p-polarized light (Heijmans et al. 2011; Sheinis et al. 2014). For HERMES, a double-pass VPH with prisms acting as reflectors was considered, but was ultimately discarded due to tight tolerances and limited bandwidth (Barden et al. 2008) (also see Sect. 4.2).
2.2 Diffraction efficiencies of VPH gratings
Many papers have been written about VPH grating theory. One of the most frequently cited examples is Kogelnik (1969), who provided an approximation for the first-order diffraction efficiencies in both polarizations. This equation is given by
![Mathematical equation: $\[\eta=\frac{1}{2} ~\sin ^2\left(\frac{\pi \Delta n_g d}{\lambda ~\cos~ \alpha_2}\right)+\frac{1}{2} ~\sin ^2\left(\frac{\pi \Delta n_g d}{\lambda ~\cos~ \alpha_2} \cos \left(2 \alpha_2\right)\right),\]$](/articles/aa/full_html/2025/06/aa54218-25/aa54218-25-eq5.png) (5)
(5)
where the first term is for s-polarized light, and the second term is for p-polarized light. In Eq. (5), Δng refers to the index modulation of the grating, d is the thickness of the grating (excluding substrate), αi is the angle of incidence and λ is the wavelength. Baldry et al. (2004) also described in detail how a VPH grating can be optimized to become a Dickson grating. In summary, the thickness and index modulation are tuned to maximize efficiency while forcing equality of both terms in Eq. (5). A requirement is that this happens at or very near the Bragg angle, allowing for reflection by the grating fringes at a very high diffraction efficiency (see Fig. 1). The Bragg condition is given by
![Mathematical equation: $\[\frac{m \lambda}{n_2}=2 \Lambda \sin \alpha_2.\]$](/articles/aa/full_html/2025/06/aa54218-25/aa54218-25-eq6.png) (6)
(6)
Figure 2 shows an example of s- and p-polarization diffraction efficiency curves as a function of grating thickness d.
Tuning a grating to match polarization diffraction efficiency curves thus allows for very high throughput at high dispersion because of the high fringe density (we recall Eq. (4)). It is important to realize, however, that the grating is only fully optimized for one wavelength. We call this wavelength λcen. Wavelengths that are different from λcen are transmitted in first order at different diffraction efficiencies. Kogelnik fortunately also derived an approximation for the full width at half-maximum (FWHM) of the bandwidth (Δλ) due to this effect. This FWHM is given by
![Mathematical equation: $\[\Delta \lambda \approx \frac{\Lambda}{d} \cot \alpha_2.\]$](/articles/aa/full_html/2025/06/aa54218-25/aa54218-25-eq7.png) (7)
(7)
When we take the optimized grating presented in Fig. 2 and consider the corrected efficiency curve by multiplying with a Gaussian efficiency function with the FWHM given by Eq. (7), we find the curve shown in Fig. 3. The bandwidth is reduced quite significantly by this effect. We conclude that the Dickson grating can be tuned to produce a very high diffraction efficiency in first order, but it only works over a limited wavelength range.
Examples of astronomical spectrographs that use a VPH grating as the main disperser.
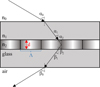 |
Fig. 1 Diagram of a VPH grating. The dichromated gelatin layer of refractive index n2 and index modulation Δng is immersed in two glass plates of refractive index n1. d is the thickness of the DCG layer, and Λ is the seperation between fringes. For a VPH grating in Littrow condition αi = βi. |
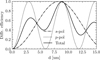 |
Fig. 2 Example of the Kogelnik efficiency curves for s- and p-polarization states. Δng is 0.145, and n2 is 1.3. This grating is tuned at a DCG layer thickness of 9 μm for a wavelength of 1040 nm with 1400 fringes/mm and an (close to Bragg) incidence angle of α2 = 34.55°. For this thickness, the diffraction efficiency for unpolarized light reaches near unity. This efficiency curve does not include potential reflection and absorption losses. |
2.3 A VPH in double pass
In some optical layouts, it can be advantageous to place dispersive (or other) optical elements in a multipass configuration. The dispersive power and spectral resolution of that optical element can then be multiplied by a factor equal to the number of passes (Wiggins & Saksena 1958; Lowenthal et al. 1966). This can reduce the weight, size, complexity, and cost of instruments. For example, a VPH grating in double pass will increase the dispersive power and spectral resolution twofold. Because this light passes through the grating twice, however, this will also reduce the effective bandwidth of the setup. Additionally, as the light is already dispersed at the second pass, this causes the light to hit the grating slightly off-Bragg, which reduces the throughput further. We show below, however, that this effect has nearly no impact on our application case.
A diagram of a VPH in double pass can be found in Fig. 4. To determine how the efficiency drops off-Littrow, we used Eqs. (4) and (5). First, we integrated Eq. (4) from λcen to λ to form
![Mathematical equation: $\[\beta(\lambda)=\beta_0+\left(\lambda-\lambda_{\mathrm{cen}}\right) \frac{m \cdot \rho}{\cos \beta_0}.\]$](/articles/aa/full_html/2025/06/aa54218-25/aa54218-25-eq8.png) (8)
(8)
At the second pass through the grating, we defined the incident angle as
![Mathematical equation: $\[\alpha_{I I, 0}(\lambda)=\beta(\lambda).\]$](/articles/aa/full_html/2025/06/aa54218-25/aa54218-25-eq9.png) (9)
(9)
Substituting this term into the original Kogelnik efficiency equation (Eq. (5)) provides a wavelength-dependent diffraction efficiency,
![Mathematical equation: $\[\eta(\lambda)=\frac{1}{2} \sin ^2\left(\frac{\pi \Delta n_g d}{\lambda ~\cos~ \alpha_{I I, 0}(\lambda)}\right)+\frac{1}{2} \sin ^2\left(\frac{\pi \Delta n_g d}{\lambda ~\cos~ \alpha_{I I, 0}(\lambda)} \cos \left(2 \alpha_{I I, 0}(\lambda)\right)\right).\]$](/articles/aa/full_html/2025/06/aa54218-25/aa54218-25-eq10.png) (10)
(10)
We now examine the effect of the new wavelength-dependent diffraction efficiency on the efficiency curve of our previously simulated grating (Figs. 2 and 3). The new theoretical diffraction efficiency curve of the VPH grating in double pass is shown in Fig. 5. We find that overall we lose up to ~4% in diffraction efficiency when taking into account the wavelength-dependent incidence angle. This fraction is near negligible when comparing it to the efficiency losses caused by the FWHM correction introduced by Eq. (7). We conclude that the effects are minimal and that the effective bandwidth with a >50% diffraction efficiency in double pass is >100 nm.
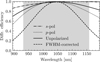 |
Fig. 3 Diffraction efficiency curves vs. wavelength. The dotted and dash-dotted lines show the efficiency curves for the two polarization states from Eq. (5). The solid line shows the efficiency curve for unpolarized light. The dashed line shows the efficiency curve after correction for the bandwidth using Eq. (7). The shaded region shows the FWHM. |
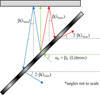 |
Fig. 4 VPH in double pass. The grating is placed in Littrow, implying that α0 = β0 for λcen. We can see that for wavelengths other than λcen, they will hit the grating at an angle different from α0 at the second pass. How much these rays are off-Littrow is determined by the single-pass dispersion (Eq. (4)). |
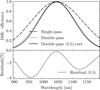 |
Fig. 5 Theoretical diffraction efficiency curves of the grating in single pass, double pass (multiplying twice by the Gaussian efficiency function from Fig. 2), and double pass taking into account the wavelength-dependent incidence angle at the second pass. In the lower frame, we plot the residuals between the two double pass solutions. |
3 Results
3.1 Measurement setup
To be able to determine and verify the theoretical performance of the VPH we presented in Sect. 2, we assembled two experimental setups: one setup to determine the diffraction efficiency in single pass, and the other to determine the dispersion in double pass. Both measurements relied on many of the same components: a wavelength tunable laser, a fiber injection mechanism, a spectrum analyzer, a collimator, and a near-infrared detector. Figures A.1 and A.2 in Appendix A show diagrams of our test setups.
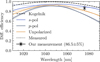 |
Fig. 6 First-order diffraction efficiency measurements and simulations in single-pass configuration of the VPH. The simulated efficiency includes the Kogelnik approximation (dashed black line) and RCWA-derived values. The solid (RCWA) and dotted lines (measurement) were supplied by the manufacturer Wasatch Photonics. |
3.2 Diffraction efficiency
The wavelength-tunable laser we used in our measurements was single-mode and tunable from ~1075 nm to ~1090 nm. Given the delicate alignment of the rotating setup where we can switch between VPH and fold mirror (see Appendix A Fig. A.1), we only performed an efficiency measurement for one wavelength at 1075.9 nm. The laser was connected through polarization-maintaining (PM) fibers and attenuators, and because of how our fiber was injected, we therefore only measured s-polarization. Furthermore, depending on the chosen wavelength for our laser, we noted quick subsecond power oscillations at the photodiode, and the mode-locking of the laser might therefore not be very stable. As we show later in Sect. 3.4, this is indeed the case. Likely, the laser mode-switching introduced polarization fluctuations, that resulted in power oscillations at the diode. A linear polarizer was added to mitigate any potential polarization crosstalk effects and remove the p-polarized component. The measurement wavelength of 1075.9 nm was chosen because we recorded the weakest power fluctuations (<5%) for this mode.
In Fig. 6, we compare our measured efficiency value to simulated efficiency values through the Kogelnik Equation (5) as in Fig. 2, rigorous coupled-wave analysis (RCWA) including reflection and absorption losses, and efficiency measurements supplied by the manufacturer. The measured unpolarized and p-polarized efficiency curves demonstrate strong agreement with the RCWA simulated curves. The s-polarized light measurements, however, show greater deviation. Several factors may contribute to these discrepancies: variations in the bulk refractive index, index modulation and effective thickness of the DCG layer, and to a lesser extent, the thickness and flatness of the AR-coating. These parameters cannot be measured directly, resulting in inevitable small deviations between actual values and those used in the models. These can significantly affect peak efficiency, curve steepness, and centering around the central wavelength, becoming more apparent and having a larger impact towards the bluer end of the spectrum. Our diffraction efficiency value agrees well with the RCWA simulated values and measurements supplied by the manufacturer. The Kogelnik efficiency value is higher, but this is consistent with theory as they do not account for reflection and absorption losses at or in the various layers of the grating. Based on our previously presented simulations in Fig. 5, we expected to be able to reach similar efficiencies at the second pass with a few percent of additional losses at the edges of the band.The single-pass diffraction efficiency curves in Fig. 6 shpw that this grating should allow us to reach >50% diffraction efficiency over a 100 nm bandwidth in double pass, with a peak efficiency of about 80%. This value depends on the losses at the reflector before the second pass. Standard silver, aluminum, gold, or dielectric coatings already allow for a very high reflection efficiency over a large wavelength regime, however, so that this should not be a major loss contributor for most wavelengths. It is also important to note that further losses could be induced at the AR coating on second pass as the incidence angle will not be fully optimal.
3.3 Theoretical dispersion and resolution
As shown by Wiggins & Saksena (1958) and Lowenthal et al. (1966), for a plane grating in double pass, the dispersion, resolution, and diffraction efficiency should be multiplied by twice that of the single-pass equivalent. They noted that this only applies to an ideal case where the grating is in Littrow for both passes and the full beam falls on the grating. Because a grating is typically slightly off-Littrow to offset entrance and exit slits, there are usually some losses. Depending on the grating size, it might also not allow for the full beam to be captured on the second pass, which downgrades efficiency and possibly resolution. To determine the dispersion and resolution in double pass and verify the hypotheses of Wiggins & Saksena (1958) and Lowenthal et al. (1966), we modified the setup of Fig. A.1 into the setup shown in Appendix A, Fig. A.2. This setup placed the grating in Littrow in single and double pass. With the beamsplitter in the second pass, we isolated the beam that has traveled through the VPH twice. By imaging this spectrum, we verified the dispersive power by changing the laser wavelength and computed the angular dispersion from linear dispersion as seen on the detector. The spot size at the focus shows the resolving power.
For our measurements, the wavelength of the laser was tuned to two single modes close to 1077 nm. The total beam diameter of the collimator in our setup was 400 mm. We therefore placed an iris in front of the grating to cut the beam to a diameter of 10 ± 0.2 mm.
We express the spectral resolution as the FWHM of a monochromatic line recorded on the detector expressed in linear (as opposite to angular) scale, denoted by parameter s. The three components listed below, the entrance slit, iris, and grating, will eventually determine the resolving power, that is, the wavelength of the line divided by the FWHM of the line expressed on the wavelength scale determined by the linear dispersion.
The entrance slit. This is the fiber size (6 μm monomode fiber in our setup). The spot size on the focal plane is determined by the magnification M (1 in our case), multiplied by the slit size,
![Mathematical equation: $\[s_{\mathrm{fib}}=d_{\mathrm{fib}} \cdot M=d_{\mathrm{fib}} \cdot \frac{f_{\mathrm{cam}}}{f_{\mathrm{coll}}}=d_{\mathrm{fib}}.\]$](/articles/aa/full_html/2025/06/aa54218-25/aa54218-25-eq11.png) (11)
(11)The iris. The divergence of the slit is given by
![Mathematical equation: $\[\theta=\frac{\lambda}{D}\]$](/articles/aa/full_html/2025/06/aa54218-25/aa54218-25-eq12.png) . Consequently, the spot size on the focal plane is given by:
. Consequently, the spot size on the focal plane is given by:
![Mathematical equation: $\[s_{\text {iris }}=\frac{\lambda}{d_{\text {iris }}} \cdot f_{\text {cam}}.\]$](/articles/aa/full_html/2025/06/aa54218-25/aa54218-25-eq13.png) (12)
(12)-
The grating. The reciprocal linear dispersion of the grating is given by
![Mathematical equation: $\[D_{\mathrm{rec}}=\frac{d_{\mathrm{groove}} \cdot ~\cos \beta}{2 \cdot m \cdot f_{\mathrm{cam}}},\]$](/articles/aa/full_html/2025/06/aa54218-25/aa54218-25-eq14.png) (13)
(13)where dgroove is the groove size, m is the order of diffraction, and the factor of 2 is introduced by the grating being in double pass, which doubles the dispersion and halves the reciprocal dispersion. This value has units of nm/mm. It therefore relates a change in wavelength (in nm) across distance on the focal plane (in mm). We used the equation for the resolving power R = λ/Δλ to derive the spot size,
![Mathematical equation: $\[s_{\text {groove }}=\frac{\Delta \lambda}{D_{\text {rec }}}=\frac{2 \cdot m \cdot \lambda \cdot f_{\mathrm{cam}}}{R \cdot d_{\text {groove }} \cdot ~\cos \beta}.\]$](/articles/aa/full_html/2025/06/aa54218-25/aa54218-25-eq15.png) (14)
(14)The diffraction-limited resolving power of the double-pass grating is given by R = 2 · N · m, where N is the number of illuminated lines, given by diris/(cosβ dgroove). The multiplication factor of 2 was again added for the double-pass configuration. Consequently, we find that the spot size as a result of divergence from the grating is given by
![Mathematical equation: $\[s_{\text {groove }}=\frac{\lambda}{d_{\text {iris }}} \cdot f_{\text {cam}},\]$](/articles/aa/full_html/2025/06/aa54218-25/aa54218-25-eq16.png) (15)
(15)which is equal to the spot size introduced by diffraction from the iris.
Trivially, the spot size introduced by divergence from the entrance slit is significantly smaller than the limiting spot size introduced by divergence from our iris and grating. The resolving power of our demonstrator spectrograph should thus be diffraction-limited by the grating or iris, not limited by the size of the entrance slit. Using the equations above we find that the spot size introduced by the iris and grating is 307 ± 8 μm. This means that any spot has a minimum FWHM equal to this value. For a pixel size of 30 μm, this corresponds to roughly 10 pixels. From this FWHM and the reciprocal linear dispersion, as computed before, we determined the maximum resolving power. The smallest resolvable wavelength Δλ is equal to the FWHM induced by the diffraction limit. In units of wavelength, this is equal to 0.0260 nm. The maximum achievable resolving power induced by divergence from the iris and grating is therefore
![Mathematical equation: $\[R_{\max }=\frac{\lambda}{\Delta \lambda}=\frac{1077 \mathrm{~nm}}{0.0260 \mathrm{~nm}}=(4.14 \pm 0.08) \cdot 10^4.\]$](/articles/aa/full_html/2025/06/aa54218-25/aa54218-25-eq17.png) (16)
(16)
In conclusion, for our measurement setup, where the wavelength, camera focal length, and dispersion are fixed, the maximum achievable spectral resolution is always limited by diffraction from the iris as long as the grating performs as expected. Because the maximum achievable spectral resolution induced by the iris aperture and grating are the same, any significant reduction in spectral resolution is a result from grating imperfections and/or an improper alignment of the grating.
For this calculation and our tests, we chose a fairly small iris aperture. Any increase in aperture size would have allowed us to reach higher spectral resolutions. The size of the clear aperture of our grating of 96 × 51 mm indicates a theoretical upper limit of Rmax = 143 000 for the resolving power. At these higher resolutions, however, the spot size would have become too small for a proper sampling with our detector. While changing the camera focal length could have addressed this sampling constraint, it would have prevented us from capturing multiple laser lines within the detector footprint, which is required to measure the dispersion, as discussed in Sect. 3.4. Therefore, a more modest spectral resolution was chosen for this demonstration.
For later comparison, we also determined the (nonreciprocal) linear dispersion D. This value solely depends on the camera focal length f, the groove density G, and the angle of diffraction β,
![Mathematical equation: $\[D=\frac{G \cdot f}{\cos \beta}=\frac{0.0014 ~\ell / \mathrm{nm} \cdot 2850 \mathrm{~mm}}{\cos~ 47.5^{\circ}}=5.91 \mathrm{~mm} / \mathrm{nm}.\]$](/articles/aa/full_html/2025/06/aa54218-25/aa54218-25-eq18.png) (17)
(17)
Since our grating is in double pass, the dispersion should be multiplied by a factor of 2. The resulting theoretical linear dispersion is thus equal to 11.82 mm/nm.
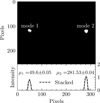 |
Fig. 7 Two stacked exposures of two different laser modes (upper panel). The image was corrected for background flux. We show that the two different modes are spatially separated as a result of dispersion by the VPH. The 1D spectrum, that resulted from stacking over the vertical axis is shown in the lower panel. The data were normalized to a peak value of one and are shown with a dashed line. The solid grey line denotes two Gaussian fits to the two peaks. These fits were used to derive the positions on the frame and FWHM of the peaks in order to derive the dispersion and resolving power. μ1 and μ2 refer to the mean values of these distributions. |
3.4 Measured dispersion and resolution
We found two laser modes that were stable in wavelength and within a close enough range to both fall on the detector. The resulting spots are shown in Fig. 7. The simultaneous spectrum analyzer measurements are shown in Fig. 8. Knowing the wavelength and spatial separation of the two modes, we computed the dispersion using the collimator focal length and pixel size. The computation was straightforward and is described in Appendix B. We obtained a value of 11.017 mm/nm, which is slightly lower than the value derived from theory, which is 11.082 mm/nm. The reason very likely is that our grating was placed slightly off Littrow, which changed the dispersion as a consequence. The computation of the real angle of refraction is also provided in Appendix B.
The spectral resolution was derived from the FWHM of an individual mode, as shown on the frame of Fig. 7. This naturally assumes that the intrinsic laser line width is significantly smaller than the FWHM. This is a fair assumption because the laser is a single-mode Fabry Perot laser diode with a cavity length of 3 mm. Combined with the fact that these are typically gold-coated, resulting in very high cavity finesse, the intrinsic laser line width should be much smaller than the smallest resolvable wavelength (QPhotonics, priv. comm.). We employed the results of the Gaussian fits from above to derive the resolving power. The values were σ1 = 4.37 ± 0.05 pix and σ2 = 4.47 ± 0.04 pix. Using the pixel size of 30 μm and the linear dispersion relation of 11.017 mm/nm derived in Appendix B, we convert these values into σλ,1 = 0.0119 ± 0.0002 nm and σλ,2 = 0.0122 ± 0.0002 nm. To derive the resolving power we employed Eq. (18),
![Mathematical equation: $\[\Delta \lambda=\mathrm{FWHM}=2 \cdot \sqrt{2 ~\ln (2)} \cdot \sigma_\lambda \approx 2.3548 \sigma_\lambda,\]$](/articles/aa/full_html/2025/06/aa54218-25/aa54218-25-eq19.png) (18)
(18)
and Eq. (19),
![Mathematical equation: $\[R=\frac{\lambda}{\Delta \lambda},\]$](/articles/aa/full_html/2025/06/aa54218-25/aa54218-25-eq20.png) (19)
(19)
where λ is the wavelength derived from the Gaussian fits in Fig. 8. This resulted in resolving powers of R1 = (3.84 ± 0.05) · 104 and R2 = (3.75 ± 0.04) · 104. We obtained a resolving power of ~38 k on average. Adjusted for the dispersion that is lower than expected from theory, this value corresponds well with our predictions and further supports the claim that our setup is diffraction-limited. There was no major deviation, and we conclude that the grating does not induce any major losses in resolving power. If we had access to more than two single laser lines, we could have improved the precision of our dispersion and resolving power measurements. Because the wavelength range we studies is very narrow, we expect no significant variations within this regime.
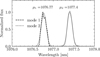 |
Fig. 8 Same two modes as displayed in Fig. 7, but now measured with the spectrum analyzer. The dashed and dotted lines show the raw data, and the solid grey lines represent Gaussian fits. The mean values of these distributions are used to derive the wavelength solution of the two modes. |
4 Design considerations for a VPH in double pass
4.1 The angle of incidence and resolving power
In a case that is not diffraction-limited, the maximum resolving power of an nonimmersed grating is given by (Baldry et al. 2004)
![Mathematical equation: $\[R=\frac{\lambda}{\Delta \lambda}=\frac{f_{\text {col }}}{\theta_s f_{\text {tel }}}\left(\tan \left(\alpha_0\right)+\frac{\sin \left(\beta_0\right)}{\cos \left(\alpha_0\right)}\right).\]$](/articles/aa/full_html/2025/06/aa54218-25/aa54218-25-eq21.png) (20)
(20)
For a Littrow case (αi = βi), the equation reduces to the very familiar equation
![Mathematical equation: $\[R=\frac{f_{\mathrm{col}}}{\theta_s f_{\mathrm{tel}}} 2 ~\tan \left(\alpha_0\right).\]$](/articles/aa/full_html/2025/06/aa54218-25/aa54218-25-eq22.png) (21)
(21)
For α0 values between 0° and 90°, we find that for a fixed telescope and collimator focal length and a fixed slit size, the resolving power increases for an increasing angle following a tangent relation. For a double-pass setup, we already know that we can double the spectral resolving power for the same angle of incidence. In Fig. 9 we compare the two trends. A resolving power of 200 000 would require a very steep AOI of about 75° for a single-pass VPH. For a double-pass solution, the AOI is a more modest (but still steep) 63°. It is important to note here that not every AOI will give a high diffraction efficiency. As discussed before, this is only achieved when the Bragg condition is satisfied (Eq. (6)), and this angle is close to the blaze angle of the grating. In other words, a grating that has been designed to work at a specific angle of incidence can typically not be used at a smaller AOI, but can be used in double pass to achieve the same resolving power.
Circumventing a very steep AOI would require a smaller slit, typically requiring adaptive optics (AO) to keep high throughput. We begin to see why (for a seeing-limited case) reaching a very high resolving power with a VPH works better for smaller telescopes.
It is not impossible to achieve a steep AOI on the grating. For example, slanted fringes and immersion of the grating in prisms (turning it effectively into a grism) can be used to achieve a high AOI on the grating, but not on the air-to-glass surface. For example, Arns & Dekker (2008) investigated VPH gratings with slanted fringes as a possible alternative for the cross-dispersers in the ESPRESSO instrument (Pepe et al. 2010) and CODEX (Pasquini et al. 2010) (which by now goes under the name ANDES, Marconi et al. 2022). The prism after the first pass might also be designed to use total inner reflection, which would effectively remove the second air-to-glass interface. Slanted fringes and grisms come with their own caveats, however, such as a changing tilt or curvature of the fringes (Rallison & Schicker 1992), and the tolerances on the optical quality of the prisms are tight (Barden et al. 2008).
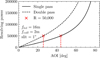 |
Fig. 9 Resolving power vs. angle of incidence on a nonimmersed grating for a single-pass and double-pass configuration. The focal lengths and slit size were fixed. |
4.2 Tolerances and detector
For a VPH grism, either a single block of glass for the prism could be used, which would be extremely heavy given the sizes and angles for high-spectral-resolution gratings, or a set of parallel prisms. The latter option presents challenges in tolerance, as individual prisms would need to be phased in wavelength, which would introduce manufacturing or assembly tolerances on the order of a fraction of a wavelength. We therefore consider our solution with a plane mirror behind the VPH as the simpler solution. The optical alignment of the mirror is not very challenging and can be compared to the alignment of a blazed grating that is slightly misaligned to offset entrance and exit slits of the spectrograph. Even without a grism, operating a VPH in double-pass configuration can impose stricter tolerances on the optical quality of its surfaces compared to a single-pass layout (e.g., on flatness and wavefront error), especially in a diffraction-limited scenario where the wavefronterror budget is significantly tighter. In a diffraction-limited case, however, gratings can be made smaller to achieve the desired resolution, which will help to achieve tighter tolerances. Consequently, for AO-assisted telescopes, where the targets have a smaller footprint on the focal plane, grating footprints can also be smaller. For high-Strehl AO systems, the grating size is independent of the telescope size and solely depends on resolution and wavelength.
The bandwidth of our VPH spectrograph will be reduced with increasing line density and angle of incidence. When we take a fixed grating period but increasing AOI and thus increasing resolution (see Eq. (20)) and compare the number of pixels required to sample the full effective bandwidth at 2 pixels per resolution element, we find Fig. 10.
The result is that even 4K detectors are by far not large enough to sample the full efficient bandwidth of these VPHs. This becomes even more significant for a finer sampling than 2 pixels per resolution element, which is typically preferred at high spectral resolutions to sample narrow spectral lines.
We finally point out that this latter discussion is based on a design simplification since a grating cannot be efficient at any AOI (or spectral resolution) for a fixed grating period. Custom optimization is always necessary to achieve maximum efficiency, where the thickness of the grating, modulation of the refractive index, and density of the groove are optimized to match the Bragg and blaze angle.
When we compared a double-pass VPH with cross-dispersed echelle gratings, we found that the VPH delivers higher efficiencies throughout the full effective bandwidth that can be measured by any commercially available detector or even detector mosaics. However, echelle gratings enable us to cover a larger wavelength regime by their efficient use of 2D detector arrays. Therefore, for applications requiring a very broad wavelength coverage, such as high-precision radial velocity measurements where many spectral lines must be resolved, echelle spectroscopy proves more effective. Conversely, for science requiring narrower wavelength bands (<100 nm), the double-pass VPH offers superior efficiency. Furthermore, in spectrographs with multiple slits or fibers, the VPH presents a practical advantage over echelle gratings by eliminating the risk of overlap between neighboring spectral orders. It should be noted that for VPH spectrographs covering wider wavelength regimes, the camera design necessarily becomes larger, as the extended spectral trace requires larger optics to prevent vignetting.
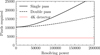 |
Fig. 10 Resolving power (horizontal axis) and the number of pixels required in one line to sample the full effective bandwidth of the grating (vertical axis). We used the assumption that every Δλ element is sampled by two pixels. The two black lines show the curves for a single- and double-pass setup, where the double-pass line is dashed. A single-pass grating requires more pixels because it produces a larger effective bandwidth. The solid red line shows a 4K detector. |
5 Conclusions
We presented a method for achieving (ultra-)high spectral resolution with a very high diffraction efficiency by using a VPH grating in a double-pass configuration as part of the development of the NIGHT instrument. We found that our grating reached a very high double-pass diffraction efficiency of 79%. Based on manufacturer measurements and RCWA simulations we estimate that it should be possible to reach a >50% double-pass diffraction efficiency over a 100 nm bandwidth. Additionally, our findings indicated that the setup is diffraction-limited and that the VPH grating does not compromise the spectral resolution when used in a double-pass arrangement. The slight discrepancy between our measured spectral resolution and theoretical expectations can be attributed to a minor misalignment of the grating.
In the field of exoplanet atmospheric characterization, where a high spectral resolution over a narrow bandwidth at a high signal-to-noise ratio is often required, instruments specifically designed around VPH gratings could be extremely beneficial. Operation in the first spectral order results in a large free spectral range, and the primary bandwidth limitation arises because the grating is not fully optimized for a broad range of wavelengths. We showed that the bandwidth defined by the grating typically exceeds what can be effectively sampled by standard off-the-shelf detectors. We also discussed several design considerations that are important for the development of double-pass VPH-based instruments like this.
Acknowledgements
Part of this work has been carried out within the framework of the NCCR PlanetS supported by the Swiss National Science Foundation. We acknowledge support from the Swiss National Science Foundation (SNSF) under grants 184618, 51NF40182901, and 51NF40205606. We would like to thank the anonymous referee for their constructive feedback that helped improve this manuscript.
Appendix A Measurement setups
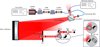 |
Table. A.1 Setup used to determine diffraction efficiency in a single-pass configuration. A laser driver powers a wavelength-tunable laser diode which feeds light into a single-mode (SM) fiber. The fiber is connected to two attenuators, of which one is tunable. These attenuators ensure that the detector is not saturated within reasonable integration times. After the attenuators, light is injected and sent through a 50/50 beamsplitter. The reflected component is sent into a spectrum analyzer which allows for constant monitoring of the wavelength sent out by the tunable laser. The transmitted component is collimated by a 40cm off-axis parabola (focal length: 2580 mm). A linear polarizer and iris form the entrance pupil of the grating measurement setup. The collimated beam can be sent through the VPH or reflected by a plane mirror. A secondary plane fold mirror and a doublet form the camera of the system and focus light on a photodiode which allows for power measurement. |
 |
Table. A.2 Setup used to determine the dispersion and resolving power of the VPH grating in double pass. Overall, the optical layout is very similar to the setup in Fig. A.1. The only difference is that the linear polarizer has been removed and with the help of the fold mirror, the VPH is placed in double pass. The beamsplitter that is used to inject light into the spectrum analyzer is now used in the second pass to re-direct the spectrum to a near-infrared (NIR) detector to image the resulting spectrum. |
Appendix B Computation of dispersion
The relation between angular deviation θ, collimator length f and spatial separation H follows from basic trigonometry:
![Mathematical equation: $\[\theta=2 \cdot \tan ^{-1}\left(\frac{H}{2 \cdot f}\right)\]$](/articles/aa/full_html/2025/06/aa54218-25/aa54218-25-eq23.png)
From the Gaussian fits in Fig. 7 we find a pixel separation of 281.53 − 49.60 = 231.93 pixels. Given a pixel size of 30 μm this means:
![Mathematical equation: $\[H / 2=30 ~\mu \mathrm{m} \cdot 231.93=6957.9 ~\mu \mathrm{m}=6.9579 \mathrm{~mm}\]$](/articles/aa/full_html/2025/06/aa54218-25/aa54218-25-eq24.png)
Wavelength separation following from the Gaussian fits in Fig. 8 equals 0.63 nm.
This implies that the linear dispersion is equal to:
![Mathematical equation: $\[\frac{6957.9 ~\mu \mathrm{m}}{0.63 \mathrm{~nm}}=11017 ~\mu \mathrm{m} / \mathrm{nm}=11.017 \mathrm{~mm} / \mathrm{nm}\]$](/articles/aa/full_html/2025/06/aa54218-25/aa54218-25-eq25.png)
Using the trigonometric relation above we can now compute the angular dispersion:
![Mathematical equation: $\[\frac{d \beta}{d \lambda}=2 \cdot \arctan \left(\frac{11.017 \mathrm{~mm} / \mathrm{nm}}{2580 \mathrm{~mm}}\right)=0.00427 ~\mathrm{rad} / \mathrm{nm}\]$](/articles/aa/full_html/2025/06/aa54218-25/aa54218-25-eq26.png)
The theoretical linear dispersion computed in Chapter 3.3 is 11.82 mm/nm. Following Eq. (17), we can determine the real, measured angle of diffraction β:
![Mathematical equation: $\[\beta=\arccos \left(\frac{G \cdot f}{D}\right)=\frac{0.0014 \ell / \mathrm{nm} \cdot 2850 \mathrm{~mm}}{11.017 \mathrm{~mm} / \mathrm{nm}}=47.45^{\circ}\]$](/articles/aa/full_html/2025/06/aa54218-25/aa54218-25-eq27.png) (B.1)
(B.1)
References
- Arns, J. A. 1995, SPIE Conf. Ser., 2404, 174 [Google Scholar]
- Arns, J. A., & Dekker, H. 2008, SPIE Conf. Ser., 7014, 70141R [Google Scholar]
- Arns, J. A., Colburn, W. S., Barden, S. C., & Williams, J. B. 1999, in American Astronomical Society Meeting Abstracts, 194, 09.13 [Google Scholar]
- Arns, J., Wilson, J. C., Skrutskie, M., et al. 2010, SPIE Conf. Ser., 7739, 773913 [Google Scholar]
- Baldry, I. K., Bland-Hawthorn, J., & Robertson, J. G. 2004, PASP, 116, 403 [Google Scholar]
- Barden, S. C., Arns, J. A., & Colburn, W. S. 1998, SPIE Conf. Ser., 3355, 866 [Google Scholar]
- Barden, S. C., Arns, J. A., Colburn, W. S., & Williams, J. B. 2000, PASP, 112, 809 [NASA ADS] [CrossRef] [Google Scholar]
- Barden, S. C., Bland-Hawthorn, J., Churilov, V., et al. 2008, SPIE Conf. Ser., 7014, 70144J [Google Scholar]
- Bershady, M., Barden, S., Blanche, P. A., et al. 2008, SPIE Conf. Ser., 7014, 70140H [Google Scholar]
- Bianco, A., Pariani, G., Aliverti, M., et al. 2018, SPIE Conf. Ser., 10706, 107064X [Google Scholar]
- Dickson, L. D., Rallison, R. D., & Yung, B. H. 1994, Appl. Opt., 33, 5378 [Google Scholar]
- Edelstein, J., Jelinsky, P., Levi, M., Tarle, G., & Brooks, D. 2018, SPIE Conf. Ser., 10702, 107027G [Google Scholar]
- Farret Jentink, C., Bourrier, V., Lovis, C., et al. 2023, MNRAS, 527, 4467 [CrossRef] [Google Scholar]
- Gao, J., Chen, P., Wu, L., Yu, B., & Qian, L. 2021, J. Phys. D Appl. Phys., 54, 313001 [Google Scholar]
- Gover, A., Guenther, R., Steel, D., & Bayvel, L. 2005, Encyclopedia of Modern Optics [Google Scholar]
- Heijmans, J. A. C., Gers, L., & Faught, B. 2011, SPIE Conf. Ser., 8167, 81671A [Google Scholar]
- Ishikawa, Y., Sirk, M. M., Edelstein, J., et al. 2018, ApJ, 869, 24 [Google Scholar]
- Kaeufl, H.-U., Ballester, P., Biereichel, P., et al. 2004, SPIE Conf. Ser., 5492, 1218 [NASA ADS] [Google Scholar]
- Kielkopf, J. 1981, Appl. Opt., 20, 3327 [Google Scholar]
- Kogelnik, H. 1969, Bell Syst. Tech. J., 48, 2909 [NASA ADS] [CrossRef] [Google Scholar]
- Lowenthal, J., Rank, D., & Wiggins, T. 1966, JOSA, 56, 1473 [Google Scholar]
- Marconi, A., Abreu, M., Adibekyan, V., et al. 2022, SPIE Conf. Ser., 12184, 1218424 [NASA ADS] [Google Scholar]
- Nagaoka, H., & Mishima, T. 1923, ApJ, 57, 92 [Google Scholar]
- Pasquini, L., Cristiani, S., Garcia-Lopez, R., Haehnelt, M., & Mayor, M. 2010, The Messenger, 140, 20 [Google Scholar]
- Pepe, F. A., Cristiani, S., Rebolo Lopez, R., et al. 2010, SPIE Conf. Ser., 7735, 77350F [Google Scholar]
- Rallison, R. D., & Schicker, S. R. 1992, SPIE Conf. Ser., 1667, 266 [Google Scholar]
- Saunders, W., Parker, Q., Watson, F., et al. 2001, Anglo-Aust. Observ. Epping Newslett., 97, 14 [Google Scholar]
- Shankoff, T. A. 1968, Appl. Opt., 7, 2101 [Google Scholar]
- Sharp, R., Saunders, W., Smith, G., et al. 2006, SPIE Conf. Ser., 6269, 62690G [NASA ADS] [Google Scholar]
- Sheinis, A., Barden, S., Birchall, M., et al. 2014, SPIE Conf. Ser., 9147, 91470Y [Google Scholar]
- Smith, G. A., Saunders, W., Bridges, T., et al. 2004, SPIE Conf. Ser., 5492, 410 [Google Scholar]
- Vogt, S. S., Allen, S. L., Bigelow, B. C., et al. 1994, SPIE Conf. Ser., 2198, 362 [NASA ADS] [Google Scholar]
- Wiggins, T., & Saksena, G. 1958, JOSA, 48, 429 [Google Scholar]
- Woodgate, B. E., Kimble, R. A., Bowers, C. W., et al. 1998, PASP, 110, 1183 [NASA ADS] [CrossRef] [Google Scholar]
All Tables
Examples of astronomical spectrographs that use a VPH grating as the main disperser.
All Figures
|
Fig. 1 Diagram of a VPH grating. The dichromated gelatin layer of refractive index n2 and index modulation Δng is immersed in two glass plates of refractive index n1. d is the thickness of the DCG layer, and Λ is the seperation between fringes. For a VPH grating in Littrow condition αi = βi. |
| In the text | |
|
Fig. 2 Example of the Kogelnik efficiency curves for s- and p-polarization states. Δng is 0.145, and n2 is 1.3. This grating is tuned at a DCG layer thickness of 9 μm for a wavelength of 1040 nm with 1400 fringes/mm and an (close to Bragg) incidence angle of α2 = 34.55°. For this thickness, the diffraction efficiency for unpolarized light reaches near unity. This efficiency curve does not include potential reflection and absorption losses. |
| In the text | |
|
Fig. 3 Diffraction efficiency curves vs. wavelength. The dotted and dash-dotted lines show the efficiency curves for the two polarization states from Eq. (5). The solid line shows the efficiency curve for unpolarized light. The dashed line shows the efficiency curve after correction for the bandwidth using Eq. (7). The shaded region shows the FWHM. |
| In the text | |
|
Fig. 4 VPH in double pass. The grating is placed in Littrow, implying that α0 = β0 for λcen. We can see that for wavelengths other than λcen, they will hit the grating at an angle different from α0 at the second pass. How much these rays are off-Littrow is determined by the single-pass dispersion (Eq. (4)). |
| In the text | |
|
Fig. 5 Theoretical diffraction efficiency curves of the grating in single pass, double pass (multiplying twice by the Gaussian efficiency function from Fig. 2), and double pass taking into account the wavelength-dependent incidence angle at the second pass. In the lower frame, we plot the residuals between the two double pass solutions. |
| In the text | |
|
Fig. 6 First-order diffraction efficiency measurements and simulations in single-pass configuration of the VPH. The simulated efficiency includes the Kogelnik approximation (dashed black line) and RCWA-derived values. The solid (RCWA) and dotted lines (measurement) were supplied by the manufacturer Wasatch Photonics. |
| In the text | |
|
Fig. 7 Two stacked exposures of two different laser modes (upper panel). The image was corrected for background flux. We show that the two different modes are spatially separated as a result of dispersion by the VPH. The 1D spectrum, that resulted from stacking over the vertical axis is shown in the lower panel. The data were normalized to a peak value of one and are shown with a dashed line. The solid grey line denotes two Gaussian fits to the two peaks. These fits were used to derive the positions on the frame and FWHM of the peaks in order to derive the dispersion and resolving power. μ1 and μ2 refer to the mean values of these distributions. |
| In the text | |
|
Fig. 8 Same two modes as displayed in Fig. 7, but now measured with the spectrum analyzer. The dashed and dotted lines show the raw data, and the solid grey lines represent Gaussian fits. The mean values of these distributions are used to derive the wavelength solution of the two modes. |
| In the text | |
|
Fig. 9 Resolving power vs. angle of incidence on a nonimmersed grating for a single-pass and double-pass configuration. The focal lengths and slit size were fixed. |
| In the text | |
|
Fig. 10 Resolving power (horizontal axis) and the number of pixels required in one line to sample the full effective bandwidth of the grating (vertical axis). We used the assumption that every Δλ element is sampled by two pixels. The two black lines show the curves for a single- and double-pass setup, where the double-pass line is dashed. A single-pass grating requires more pixels because it produces a larger effective bandwidth. The solid red line shows a 4K detector. |
| In the text | |
|
Table. A.1 Setup used to determine diffraction efficiency in a single-pass configuration. A laser driver powers a wavelength-tunable laser diode which feeds light into a single-mode (SM) fiber. The fiber is connected to two attenuators, of which one is tunable. These attenuators ensure that the detector is not saturated within reasonable integration times. After the attenuators, light is injected and sent through a 50/50 beamsplitter. The reflected component is sent into a spectrum analyzer which allows for constant monitoring of the wavelength sent out by the tunable laser. The transmitted component is collimated by a 40cm off-axis parabola (focal length: 2580 mm). A linear polarizer and iris form the entrance pupil of the grating measurement setup. The collimated beam can be sent through the VPH or reflected by a plane mirror. A secondary plane fold mirror and a doublet form the camera of the system and focus light on a photodiode which allows for power measurement. |
| In the text | |
|
Table. A.2 Setup used to determine the dispersion and resolving power of the VPH grating in double pass. Overall, the optical layout is very similar to the setup in Fig. A.1. The only difference is that the linear polarizer has been removed and with the help of the fold mirror, the VPH is placed in double pass. The beamsplitter that is used to inject light into the spectrum analyzer is now used in the second pass to re-direct the spectrum to a near-infrared (NIR) detector to image the resulting spectrum. |
| In the text | |
Current usage metrics show cumulative count of Article Views (full-text article views including HTML views, PDF and ePub downloads, according to the available data) and Abstracts Views on Vision4Press platform.
Data correspond to usage on the plateform after 2015. The current usage metrics is available 48-96 hours after online publication and is updated daily on week days.
Initial download of the metrics may take a while.