Fig. 3
Download original image
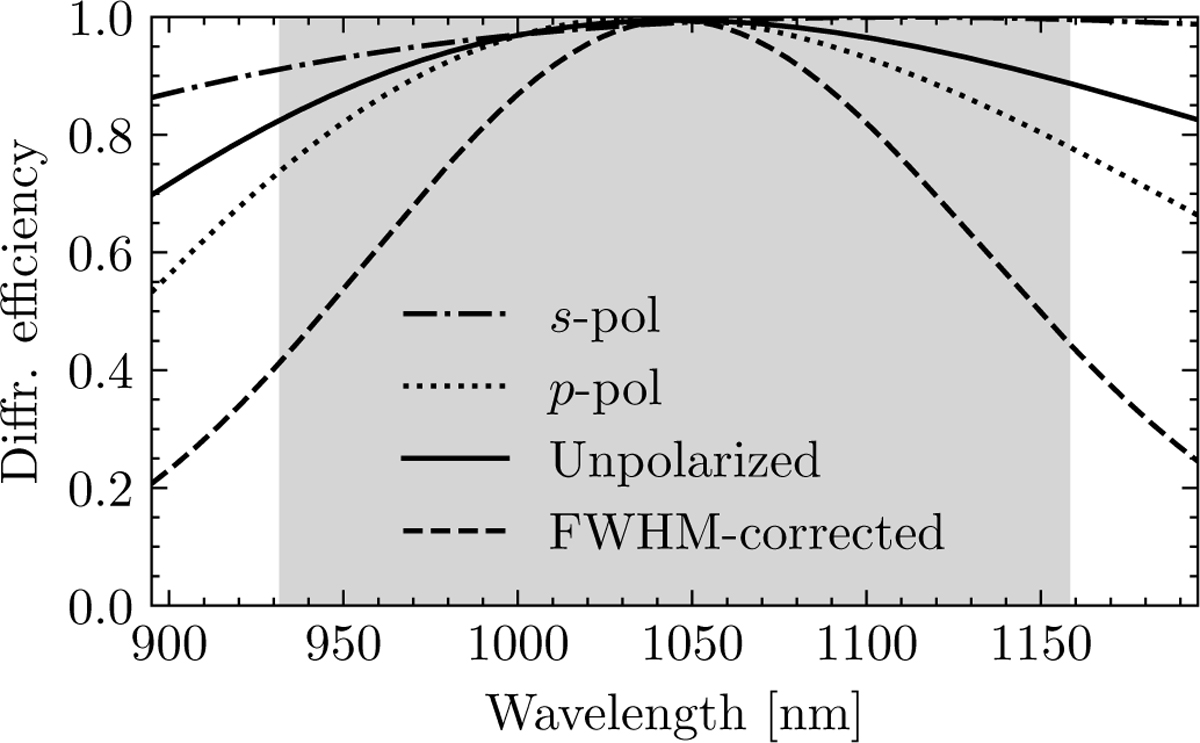
Diffraction efficiency curves vs. wavelength. The dotted and dash-dotted lines show the efficiency curves for the two polarization states from Eq. (5). The solid line shows the efficiency curve for unpolarized light. The dashed line shows the efficiency curve after correction for the bandwidth using Eq. (7). The shaded region shows the FWHM.
Current usage metrics show cumulative count of Article Views (full-text article views including HTML views, PDF and ePub downloads, according to the available data) and Abstracts Views on Vision4Press platform.
Data correspond to usage on the plateform after 2015. The current usage metrics is available 48-96 hours after online publication and is updated daily on week days.
Initial download of the metrics may take a while.