Fig. 7
Download original image
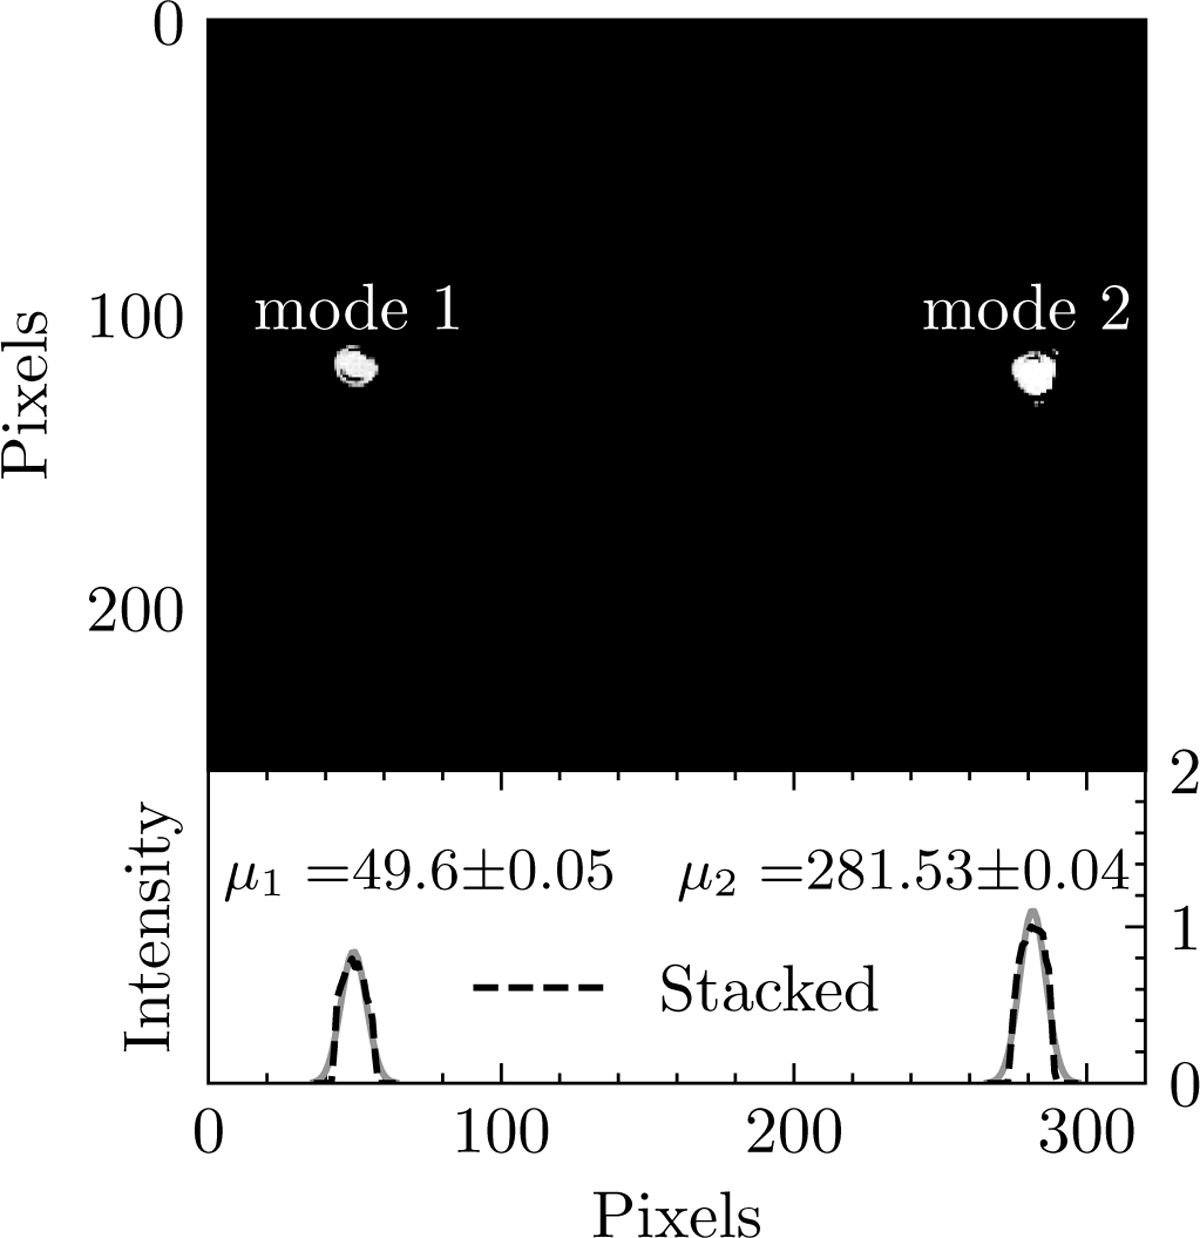
Two stacked exposures of two different laser modes (upper panel). The image was corrected for background flux. We show that the two different modes are spatially separated as a result of dispersion by the VPH. The 1D spectrum, that resulted from stacking over the vertical axis is shown in the lower panel. The data were normalized to a peak value of one and are shown with a dashed line. The solid grey line denotes two Gaussian fits to the two peaks. These fits were used to derive the positions on the frame and FWHM of the peaks in order to derive the dispersion and resolving power. μ1 and μ2 refer to the mean values of these distributions.
Current usage metrics show cumulative count of Article Views (full-text article views including HTML views, PDF and ePub downloads, according to the available data) and Abstracts Views on Vision4Press platform.
Data correspond to usage on the plateform after 2015. The current usage metrics is available 48-96 hours after online publication and is updated daily on week days.
Initial download of the metrics may take a while.