Fig. 6.

Download original image
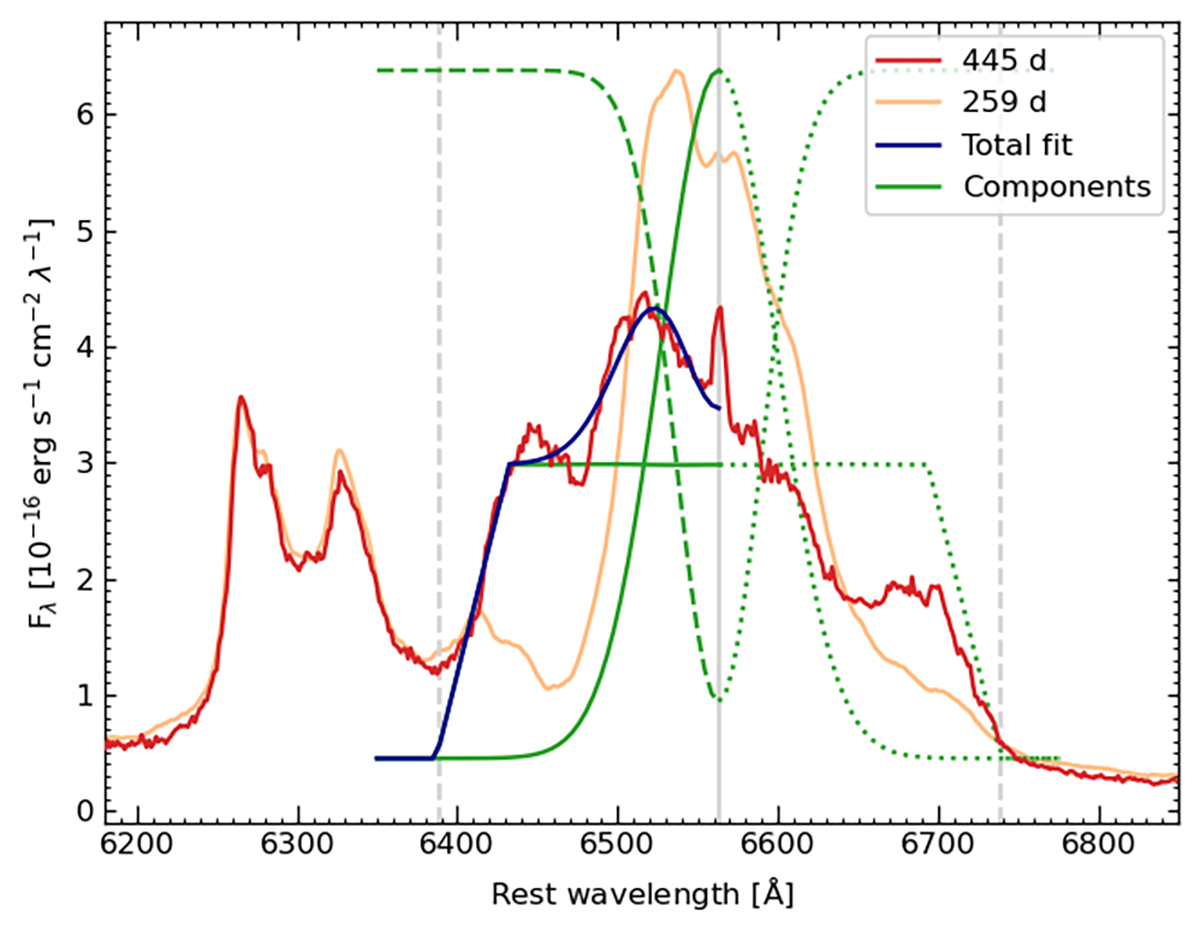
Simulated interaction-powered (trapezoid) plus radioactive-powered (Gaussian) fit to the blue side of the Hα profile in the 445 d spectrum of SN 2023ixf (red line). The total fitted profile is shown with a blue line. Green lines show the individual fit components: trapezoid and emission Gaussian in solid lines, and absorption Gaussian in dashed lines. Dotted green lines indicate the symmetrical extension of each component toward the red half of the profile. Note that the trapezoid matches the observed red edge of the line well. Vertical gray lines indicate the location of rest (solid) and ±8000 km s−1 (dashed). The scaled-down 259 d spectrum of SN 2023ixf (orange line, F24) was used to fix the amplitude of the emission Gaussian. See the text for further details.
Current usage metrics show cumulative count of Article Views (full-text article views including HTML views, PDF and ePub downloads, according to the available data) and Abstracts Views on Vision4Press platform.
Data correspond to usage on the plateform after 2015. The current usage metrics is available 48-96 hours after online publication and is updated daily on week days.
Initial download of the metrics may take a while.


