Fig. 4.
Download original image
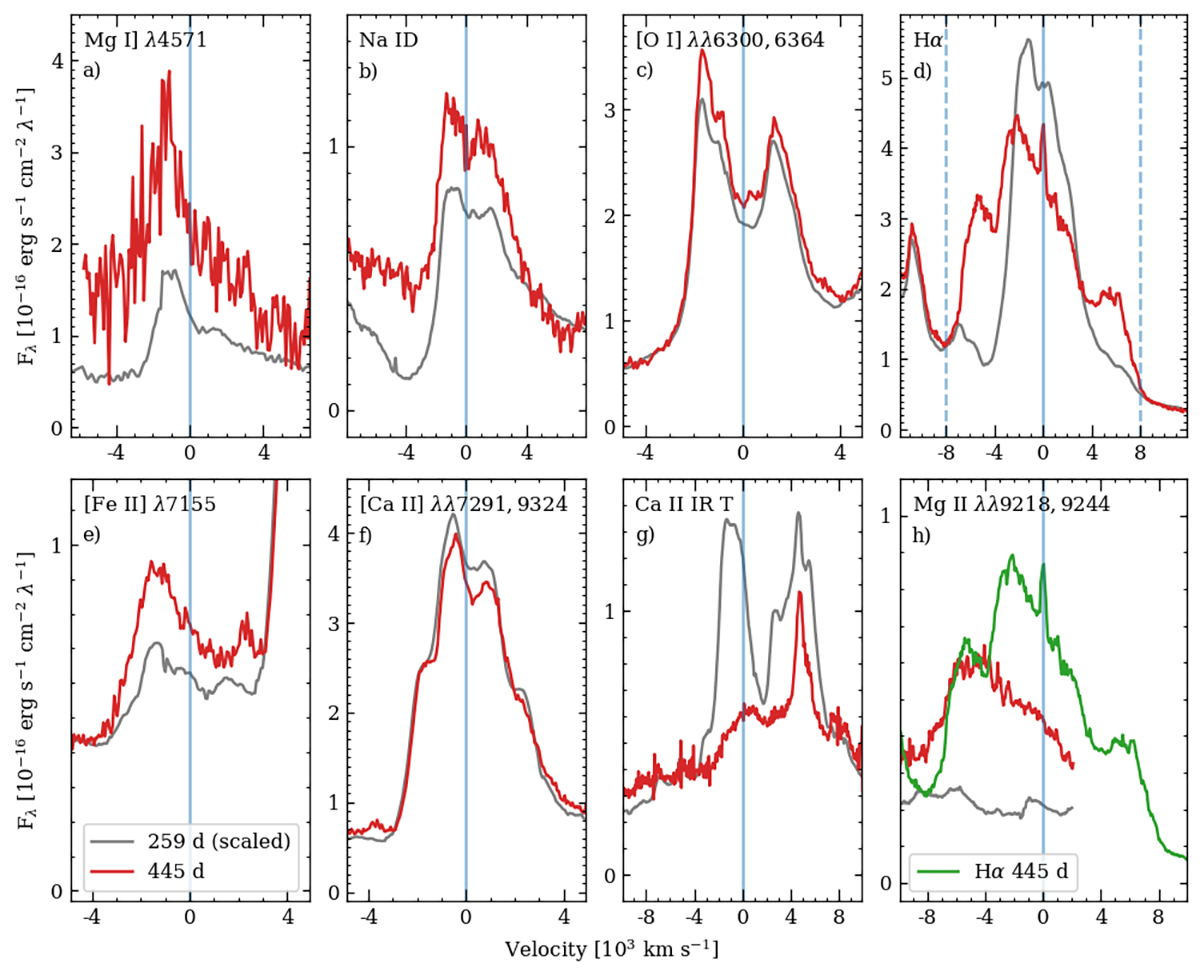
Line profiles as a function of velocity for the main emission features in the spectra of SN 2023ixf at 259 days (gray lines) and 445 days (red lines). Similarly to Figure 1, both spectra were scaled to match the R-band photometry at 445 days. Vertical lines indicate the location of rest (solid) for the reference wavelength of each line, as given below, and in panel d), additionally at velocities of ±8000 km s−1 (dashed). Panel h) shows the region of the Mg II λλ 9218,9244 feature, which is only partly covered, and it includes for reference a reproduction of the Hα profile at 445 days (green line). Reference wavelengths in each panel are: a) 4571 Å, b) 5890 Å, c) 6300 Å, d) 6563 Å, e) 7155 Å, f) 7300 Å, g) 8542 Å, and h) 9231 Å.
Current usage metrics show cumulative count of Article Views (full-text article views including HTML views, PDF and ePub downloads, according to the available data) and Abstracts Views on Vision4Press platform.
Data correspond to usage on the plateform after 2015. The current usage metrics is available 48-96 hours after online publication and is updated daily on week days.
Initial download of the metrics may take a while.