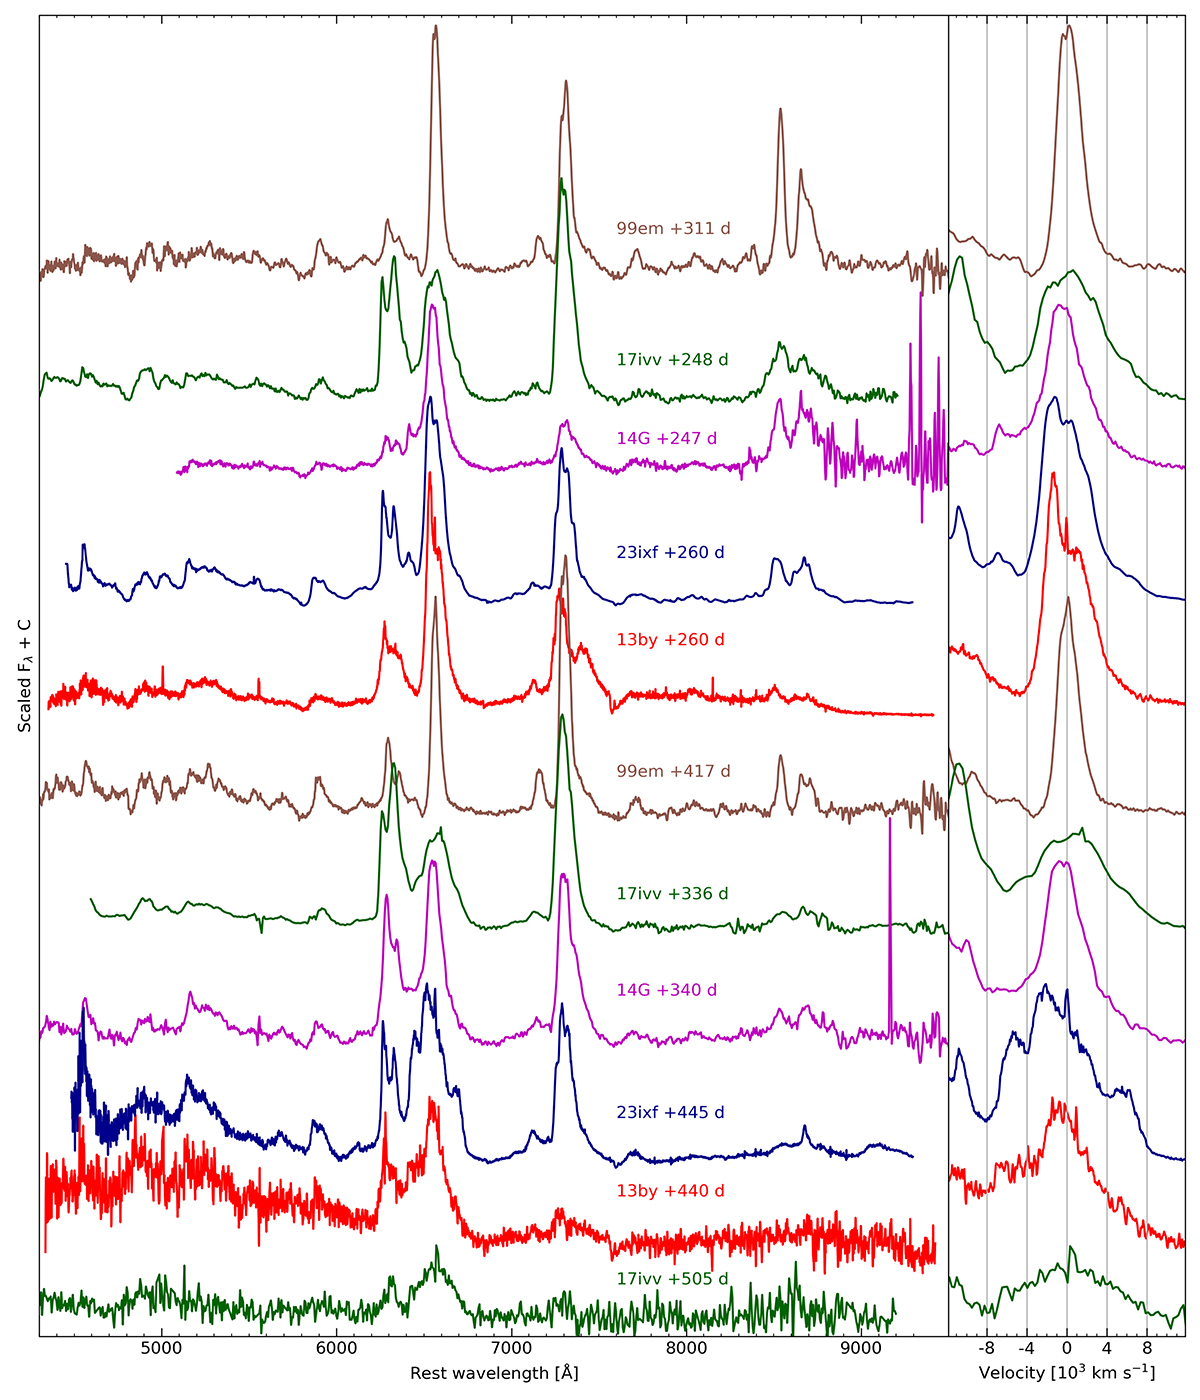
Fig. 3.
Download original image
Nebular spectra of SN 2023ixf at 259 and 445 days (blue lines) in comparison to spectra of other SNe II exhibiting interaction signatures at similar ages: SN 2013by (Black et al. 2017), SN 2014G (Terreran et al. 2016), and SN 2017ivv (Gutiérrez et al. 2020). For reference, spectra of the prototypical SN 1999em (Faran et al. 2014) are shown where no widening of the Hα profile was observed. The right panel shows a detail of the Hα profiles as a function of velocity relative to the rest wavelength of 6563 Å. Comparison data were downloaded from the Wiserep (Yaron & Gal-Yam 2012) database (https://www.wiserep.org/) and were not corrected for extinction.
Current usage metrics show cumulative count of Article Views (full-text article views including HTML views, PDF and ePub downloads, according to the available data) and Abstracts Views on Vision4Press platform.
Data correspond to usage on the plateform after 2015. The current usage metrics is available 48-96 hours after online publication and is updated daily on week days.
Initial download of the metrics may take a while.