Fig. A.1.
Download original image
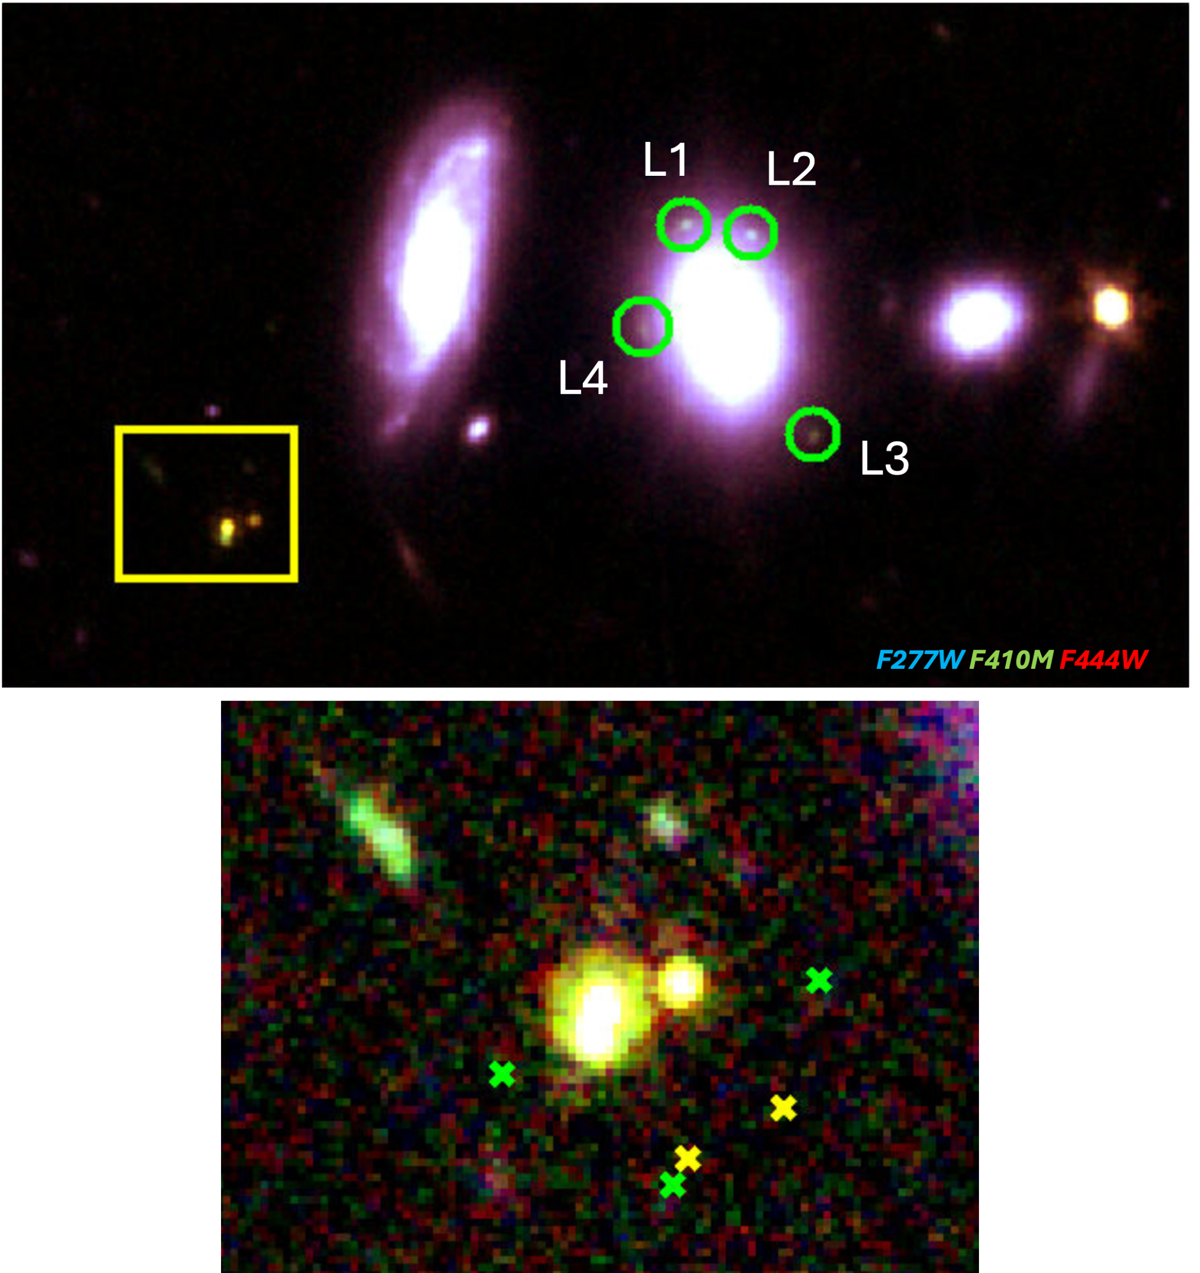
Top: 19×11 arcsec2 cutout of an RGB image based on F277W, F410M, and F444W centered around coordinates α= 2:40:02.338, δ = −1:37:15.297. The yellow square encloses the region that contains our galaxies; its dimensions are 2.8 × 2.4 arcsec2. The four multiple images of the z ∼ 7 background source are highlighted with green circles and labeled with the IDs listed in Table A.2. The green colors highlight this source’s F410M excess; we also noticed F410M excess in our galaxy sample, suggesting they are at similar redshifts. Bottom: 4×3 arcsec2 cutout of the same RGB image around our sample, with the scale saturated to also show SAT1 and SAT2. The source-plane positions of the sources after the lensing correction are depicted as crosses (yellow for the LRDs and green for the satellites).
Current usage metrics show cumulative count of Article Views (full-text article views including HTML views, PDF and ePub downloads, according to the available data) and Abstracts Views on Vision4Press platform.
Data correspond to usage on the plateform after 2015. The current usage metrics is available 48-96 hours after online publication and is updated daily on week days.
Initial download of the metrics may take a while.