Fig. 6.
Download original image
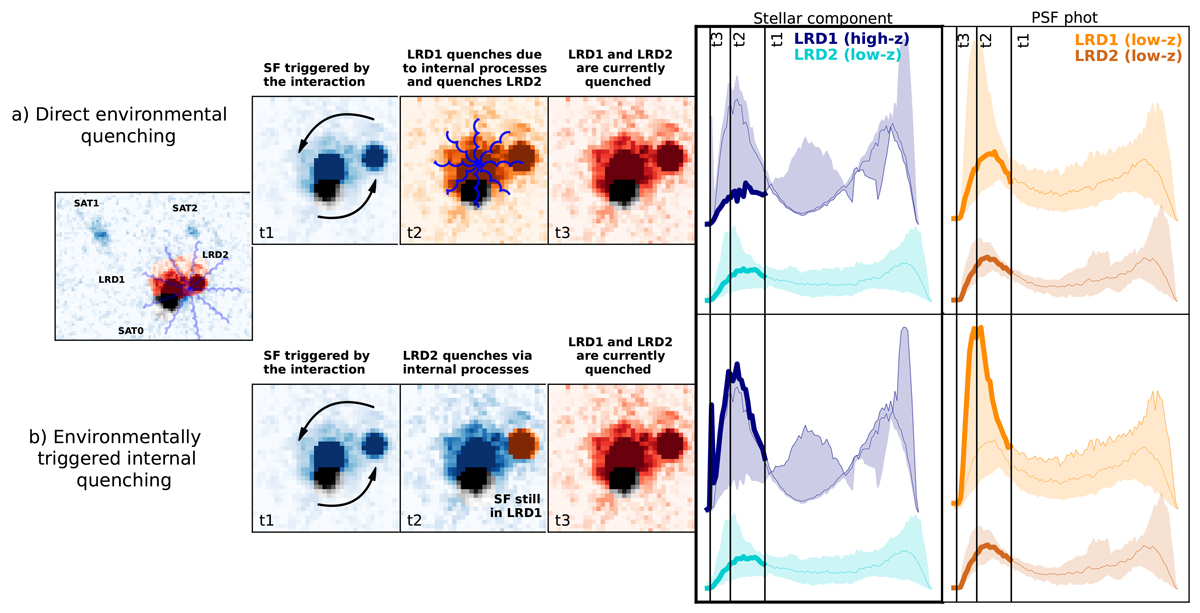
Potential scenarios for the LRDs’ SFHs. Red colors in the image cutouts indicate quenching, orange a quenching in progress, and blue star formation. SAT0 is depicted in black due to its uncertain nature. The two rows show three time steps within the last ∼ 200 Myr, marked in the SFH plots as vertical lines. Case (a) corresponds to direct environmental quenching, and case (b) shows quenching due to internal processes, triggered by the environment. LRD1 is treated as the AGN host, but the same would apply if LRD2 or both LRDs were AGN hosts. In the SFH plots (last two columns), thicker lines highlight the curves used as a reference for each case. We show the SFHs obtained with Dense Basis for the stellar component only (highlighted with thicker borders), derived by subtracting the AGN photometric points from Bagpipes from the PSF photometry (Sect. 4.3). The SFHs based on the untouched PSF photometry (Sect. 4.1) are depicted in the last column. In the panels showing the SFHs based on the stellar component, we represent the LRD1 results for the high-z case in navy (see Sect. 4.2) and the LRD2 results for the low-z case (centered at the photo-z of the galaxy group) in cyan, following the Fig. 5 color code. The low-z SFHs are represented in orange (LRD1) and brown (LRD2) in the last column, which shows the SFHs based on the untouched PSF photometry, following the Fig. 5 color code. The scaling of the SFHs is arbitrary in this cartoon and thus not indicated.
Current usage metrics show cumulative count of Article Views (full-text article views including HTML views, PDF and ePub downloads, according to the available data) and Abstracts Views on Vision4Press platform.
Data correspond to usage on the plateform after 2015. The current usage metrics is available 48-96 hours after online publication and is updated daily on week days.
Initial download of the metrics may take a while.