Fig. 5.
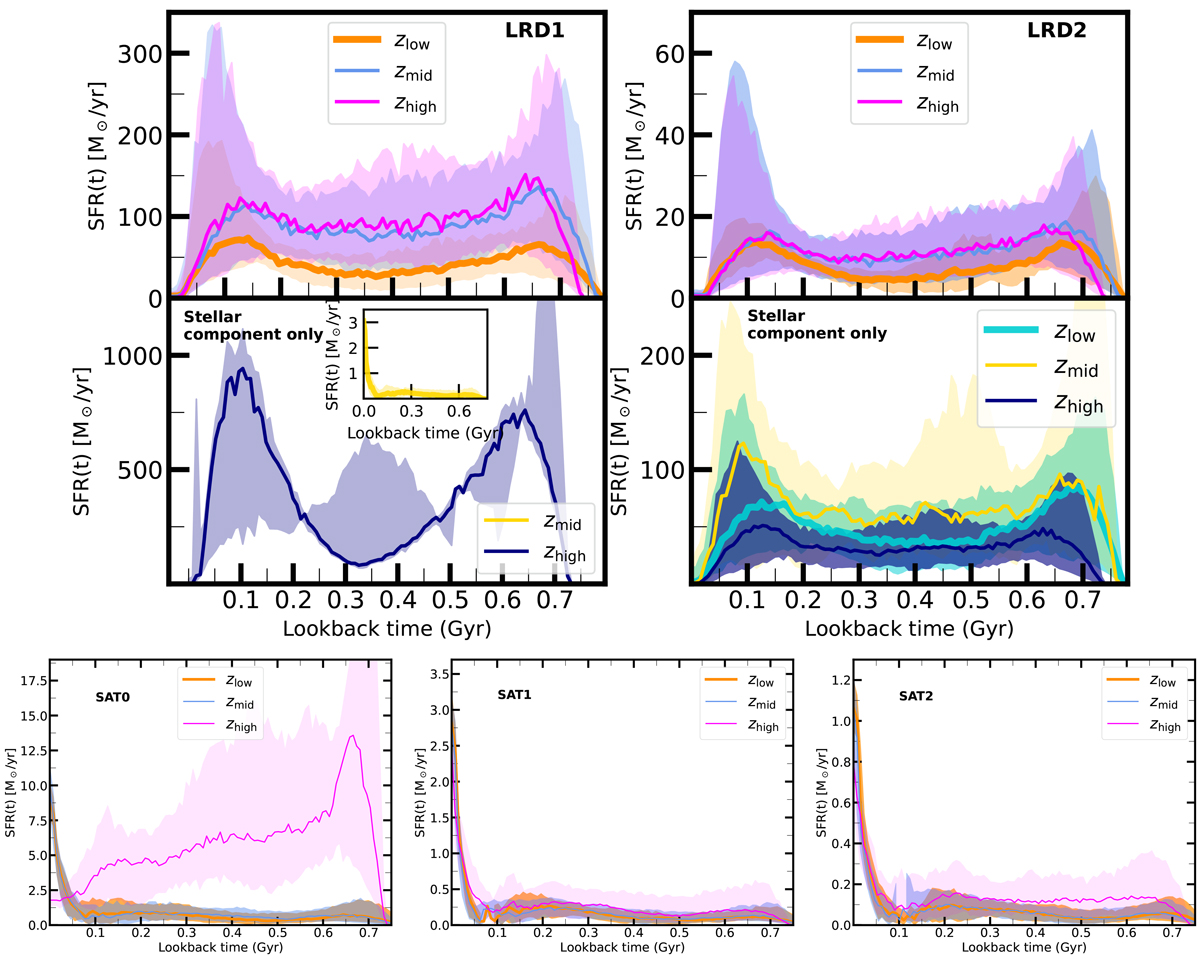
Download original image
Top panels: Dense Basis SFHs based on the LRD1 (left) and LRD2 (right) PSF photometry. Solid lines show the 50th percentile and shaded regions the 16th-84th percentiles, color-coded by redshift. The thicker line depicts the low-z case, which corresponds to the photo-z of the galaxy group. Middle panels: Dense Basis SFHs derived from the stellar component only (obtained by subtracting the AGN photometry from the PSF photometry; Sect. 4.3), color-coded by redshift. The inset in the left panel shows a zoomed-in view of the LRD1 mid-z SFH. Bottom panels (from left to right): SFHs derived for SAT0, SAT1, and SAT2, color-coded by redshift.
Current usage metrics show cumulative count of Article Views (full-text article views including HTML views, PDF and ePub downloads, according to the available data) and Abstracts Views on Vision4Press platform.
Data correspond to usage on the plateform after 2015. The current usage metrics is available 48-96 hours after online publication and is updated daily on week days.
Initial download of the metrics may take a while.