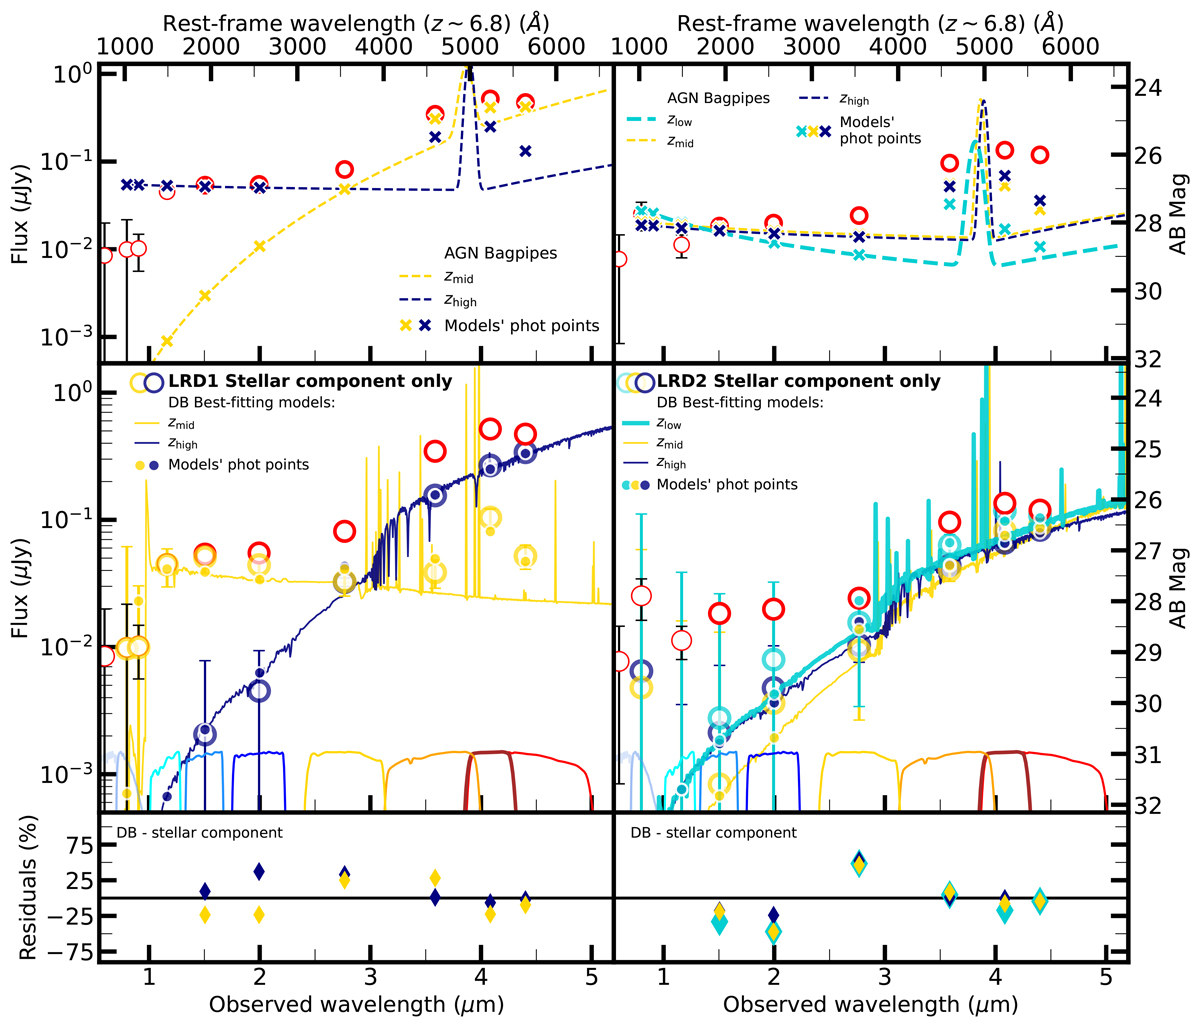
Fig. 4.
Download original image
Top panels: Potential AGN fits (dashed cyan for the low-z, yellow for the mid-z, navy for the high-z cases) for LRD1 (left) and LRD2 (right) derived using Bagpipes (Sect. 4.2). The low-z case is not represented in the LRD1 panel (left) because it did not converge in Bagpipes. Crosses depict their photometric points. Middle panels: Dense Basis fits for the stellar component of LRD1 (left) and LRD2 (right) obtained by subtracting the AGN photometry derived with Bagpipes from the PSF photometry (Sect. 4.3). The LRD PSF photometry is shown as red open circles. Photometric points from the stellar component are shown as cyan, yellow, and navy open circles for the low-, mid-, and high-z cases, respectively. Best-fit models are displayed as solid lines in the same color. The low-z case (thicker line) corresponds to the photo-z of the galaxy group. Photometric points for the models are depicted as filled circles. HST and NIRCam transmission curves are also included. Bottom panels: Residuals of the fits.
Current usage metrics show cumulative count of Article Views (full-text article views including HTML views, PDF and ePub downloads, according to the available data) and Abstracts Views on Vision4Press platform.
Data correspond to usage on the plateform after 2015. The current usage metrics is available 48-96 hours after online publication and is updated daily on week days.
Initial download of the metrics may take a while.