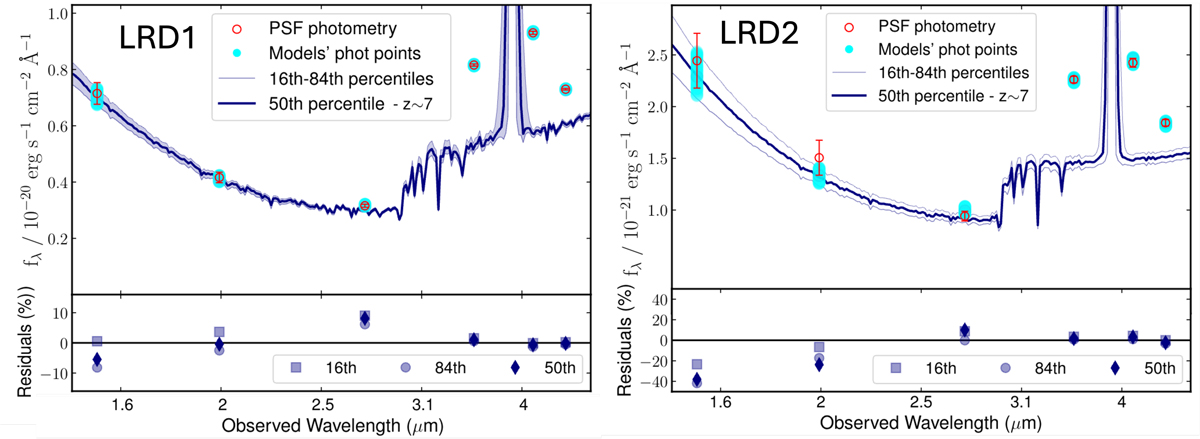
Fig. 3.
Download original image
Bagpipes best fits (stars + AGN) for LRD1 (left) and LRD2 (right) based on PSF photometry (red open circles), corresponding to the high-z solution obtained using a broad z prior. Cyan circles depict the synthetic photometric points associated with the best-fitting model, shown as a thick blue line (50th percentile). The limits of the shaded blue region represent the 16th and 84th percentiles. The residuals for the models, corresponding to the 16th (squares), 50th (diamonds), and 84th (circles) percentiles, are also included underneath each panel.
Current usage metrics show cumulative count of Article Views (full-text article views including HTML views, PDF and ePub downloads, according to the available data) and Abstracts Views on Vision4Press platform.
Data correspond to usage on the plateform after 2015. The current usage metrics is available 48-96 hours after online publication and is updated daily on week days.
Initial download of the metrics may take a while.