Fig. 1.
Download original image
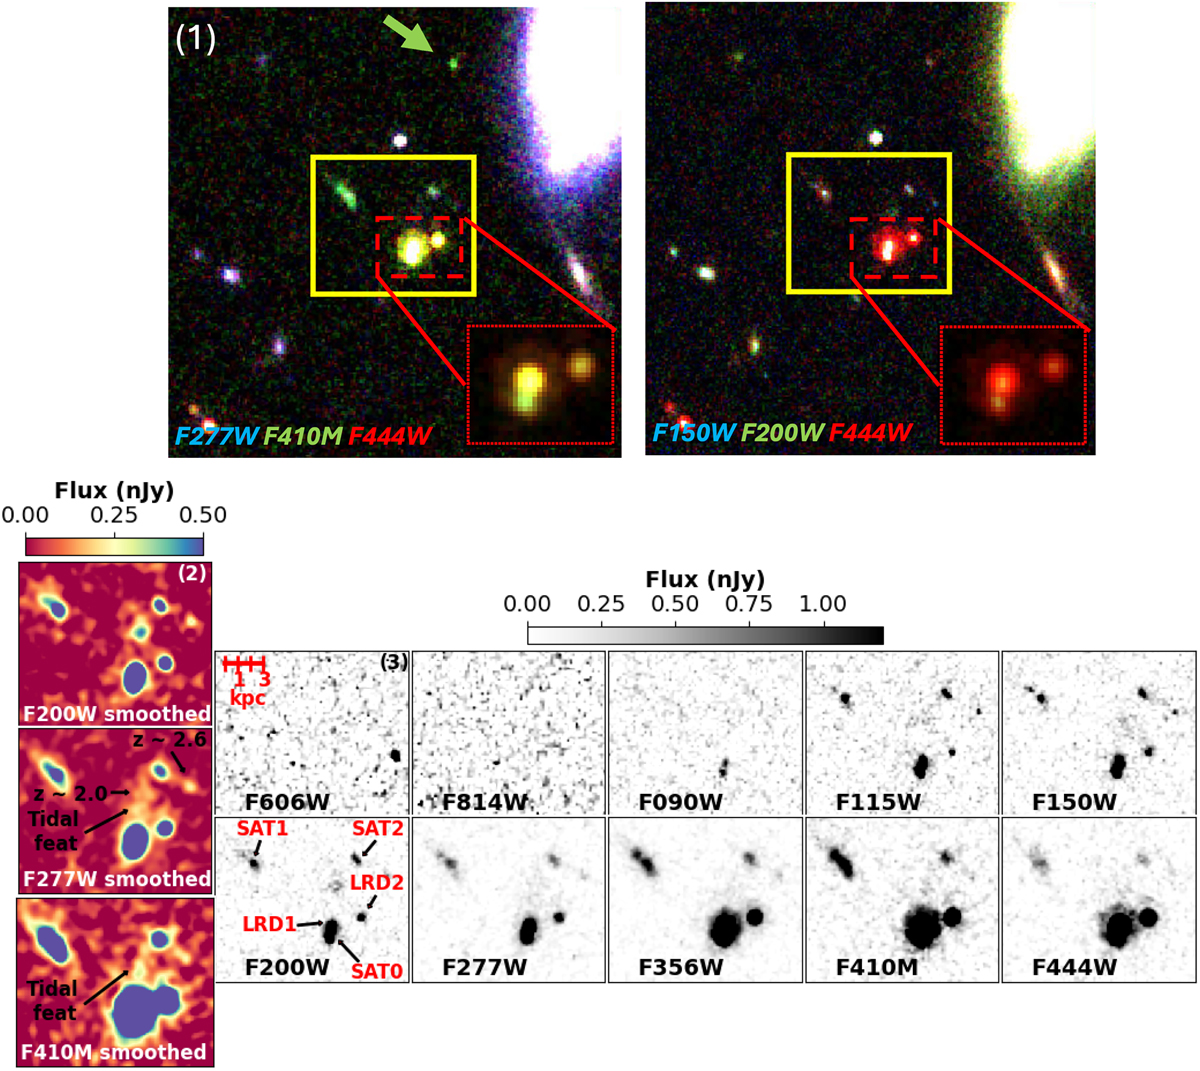
Cutouts of the galaxy group in different bands. (1): 8 × 8 arcsec2 cutouts of two RGB images based on F277W, F410M, and F444W (left) and F150W, F200W, and F444W (right) NIRCam imaging. The yellow square encloses the region that contains our galaxies; its dimensions are 2.8 × 2.4 arcsec2. These images highlight the common F410M excess (and thus the high-z nature) in this galaxy group compared to sources in the neighborhood (left) and the more prominent emission in F444W of the LRD pair compared to the satellites (right). The red squares in both panels show a zoomed-in view of the LRD pair in a less saturated scale to highlight the difference in color between the LRDs and SAT0. The arrow in the left panel points to a z ∼ 7 source ∼18 kpc away from the LRD pair, with colors similar to the satellite galaxies. (2): Cutouts of our galaxy group in smoothed versions of F200W, F277W, and F410M obtained using a Gaussian filter with σ = 1.2 pixels. (3): Postage stamps of these sources in the different HST and NIRCam bands at native spatial resolution. NIRCam images are plotted following the same scale as above. For the HST bands, the upper limit was set to 3 nJy to deal with the noise. The kiloparsec scale is not corrected for lensing magnification, which is also low at this position and redshift (μ = 1.26; see Fig. A.1).
Current usage metrics show cumulative count of Article Views (full-text article views including HTML views, PDF and ePub downloads, according to the available data) and Abstracts Views on Vision4Press platform.
Data correspond to usage on the plateform after 2015. The current usage metrics is available 48-96 hours after online publication and is updated daily on week days.
Initial download of the metrics may take a while.