Fig. 2
Download original image
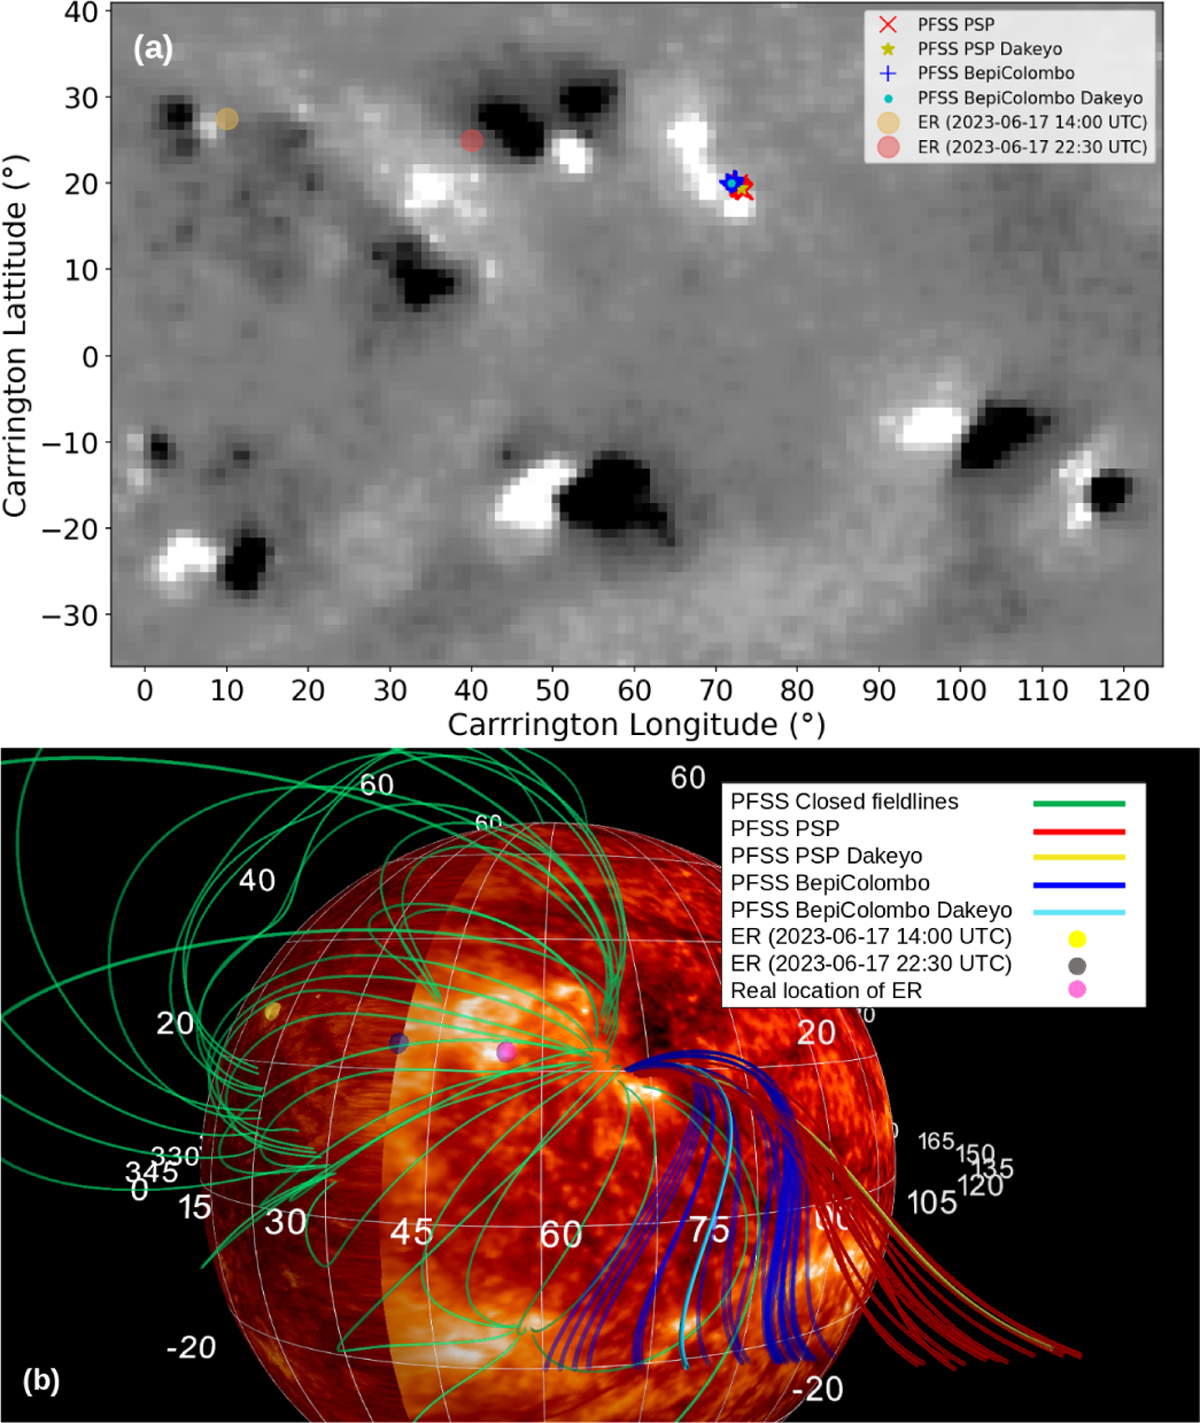
(a) ADAPT-GONG magnetogram of June 18, 2023, at 00:00 UTC, in a Carrington reference frame. The white and black spots correspond, respectively, to positive and negative radial components of the magnetic field. The blue cross and light blue dot symbol and the red plus symbol and yellow star represent, respectively, the magnetic footpoints estimated with a PFSS model, of BepiColombo and PSP, respectively. The transparent yellow and pink circles mark the location of solar eruptions automatically detected by ER from the UV AIA imager at ![]() . (b) View of the Sun seen from Mercury. The surface of the Sun is mapped with the EUI on the right side and the AIA on the left side at
. (b) View of the Sun seen from Mercury. The surface of the Sun is mapped with the EUI on the right side and the AIA on the left side at ![]() . The blue, light blue, red, and yellow lines are open magnetic field lines extrapolated with the PFSS model. The color code is the same as the one in (a). We added the coronal loops in green. The yellow and dark gray points mark the location of solar eruptions automatically detected by ER from the UV AIA imager at
. The blue, light blue, red, and yellow lines are open magnetic field lines extrapolated with the PFSS model. The color code is the same as the one in (a). We added the coronal loops in green. The yellow and dark gray points mark the location of solar eruptions automatically detected by ER from the UV AIA imager at ![]() . The pink point around
. The pink point around ![]() of longitude and
of longitude and ![]() of latitude is the real position of the eruption associated with the dark gray point.
of latitude is the real position of the eruption associated with the dark gray point.
Current usage metrics show cumulative count of Article Views (full-text article views including HTML views, PDF and ePub downloads, according to the available data) and Abstracts Views on Vision4Press platform.
Data correspond to usage on the plateform after 2015. The current usage metrics is available 48-96 hours after online publication and is updated daily on week days.
Initial download of the metrics may take a while.