| Issue |
A&A
Volume 698, May 2025
|
|
|---|---|---|
| Article Number | A43 | |
| Number of page(s) | 6 | |
| Section | Cosmology (including clusters of galaxies) | |
| DOI | https://doi.org/10.1051/0004-6361/202553846 | |
| Published online | 28 May 2025 | |
Line-of-sight velocity projection impact on Local Group mass determinations
1
Leibniz-Institut fur Astrophysik Potsdam, An der Sternwarte 16, D-14482 Potsdam, Germany
2
Institute of Theoretical Astrophysics, University of Oslo, 0315 Oslo, Norway
⋆ Corresponding author: benidav@aip.de
Received:
21
January
2025
Accepted:
14
April
2025
The mass of the Local Group (LG), which includes the Milky Way, Andromeda (M31), and their satellites, is crucial for validating galaxy formation and cosmological models. Traditional virial mass estimates, which rely on line-of-sight (LoS) velocities and simplified infall assumptions, are prone to systematic biases due to unobserved velocity components and anisotropic kinematics. Using the TNG cosmological simulation, we examined two limiting cases: the minor infall model – which ignores velocities perpendicular to LoS directions – and the major infall model – which assumes purely radial motion toward the center of mass (CoM). Our simulations demonstrate that geometric corrections are vital: the minor infall model underestimates the true mass, while the major infall model overestimates it. By applying these calibrated corrections to observed dwarf galaxy kinematics within 1 Mpc of the LG’s CoM, we derived a refined LG mass of MLG = (2.99 ± 0.60)×1012 M⊙. This finding resolves previous discrepancies as it aligns with predictions from the Λ cold dark matter model, timing arguments, and independent mass estimates. Our analysis highlights the importance of correcting for velocity anisotropy and offers a robust framework for dynamical mass estimations of galaxy groups.
Key words: galaxies: dwarf / Local Group / dark matter / dark energy
© The Authors 2025
 Open Access article, published by EDP Sciences, under the terms of the Creative Commons Attribution License (https://creativecommons.org/licenses/by/4.0), which permits unrestricted use, distribution, and reproduction in any medium, provided the original work is properly cited.
This article is published in open access under the Subscribe to Open model. Subscribe to A&A to support open access publication.
1. Introduction
The mass of the Local Group (LG), which is composed primarily of the Milky Way (MW), Andromeda (M31), and their satellite systems, is a fundamental quantity for understanding galaxy evolution and the distribution of dark matter, and for testing cosmological models (van den Bergh 1999). An accurate determination of this mass not only helps us determine local dynamics, but also provides a key benchmark for Lambda cold dark matter (ΛCDM) predictions on group scales. Yet, estimating the LG’s mass remains a long-standing challenge due to both observational constraints and theoretical uncertainties.
The timing argument (TA) model treats the LG as an isolated classical two-body system made of point-like particles with zero separation at the onset of the Big Bang. The total mass of the MW–M31 pair can be readily evaluated from their current distance from one another, their relative velocity, and the age of the Universe. Early applications of TA assumed a purely radial orbit (Li & White 2008; van der Marel et al. 2012) mostly due to the difficulty in measuring proper motion. The TAs were corrected for different effects, including the incorporation of tangential motion (van der Marel & Guhathakurta 2008; van der Marel et al. 2012), modified gravity (Partridge et al. 2013; McLeod et al. 2017; McLeod & Lahav 2020; Benisty & Capozziello 2023), the MW’s recoil velocity from the Large Magellanic Cloud (LMC; Peñarrubia et al. 2016; Benisty et al. 2022; Benisty 2024; Chamberlain et al. 2023), and the possibility of a past encounter (Benisty & Davis 2022). The results were compared to other mass estimation techniques, including numerical simulations (Lemos et al. 2021; Hartl & Strigari 2022, 2025; Sawala et al. 2023a,b; Wempe et al. 2024; Benisty et al. 2024).
A commonly employed tool for estimating group masses is the virial theorem (VT), which relates the kinetic energy of a system’s constituents to its gravitational potential (Diaz et al. 2014; Hartl & Strigari 2022). In observational studies, however, this method is limited because proper motions – especially for distant tracers – are often inaccessible or poorly constrained, and only line-of-sight (LoS) velocities for galaxies are available (Makarov et al. 2025). This incomplete view of phase space introduces significant ambiguity to dynamical modeling, as the full 3D motions of galaxies must be inferred from partial data. To deal with this limitation, simplified assumptions about the velocity field are frequently adopted. Two models that use such assumptions are the minor infall and major infall approximations (Karachentsev et al. 2007). In the minor infall model, it is assumed that the observed LoS velocity of a galaxy accounts for the entirety of its motion relative to the LG’s center of mass (CoM; Wagner & Benisty 2025). This treatment neglects transverse velocity components and tends to underestimate the system’s mass by ignoring kinetic energy in unmeasured directions.
By contrast, the major infall model assumes that the motion of the LG’s CoM itself is purely along the LoS. In this case, the radial velocities of the satellites are interpreted under the assumption that the group’s systemic motion affects only the LoS component. This method can overestimate the LG mass by artificially inflating the inferred velocity dispersion, particularly if unbound tracers or outliers contaminate the sample. Reconciling the biases introduced by these assumptions is crucial for improving the reliability of LG mass estimates. The growing availability of proper motion measurements from instruments (e.g., Gaia and the Hubble Space Telescope) as well as next-generation simulations provides an opportunity to refine our understanding of group dynamics and assess the validity of simplified models.
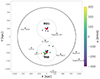 |
Fig. 1. Distribution of LG dwarf galaxies. The sample includes MW and M31 satellites along with isolated galaxies within 4 Mpc, all of which serve as tracers of LG dynamics. The data are taken from McConnachie & Venn (2020a,b). |
In this work, we employed the TNG50 simulation (see Nelson et al. 2015; Pillepich et al. 2019) as a controlled test bed for evaluating virial mass estimators under realistic conditions. We applied these calibrated estimators to the observed kinematics of dwarf galaxies within the velocity surface around the LG’s CoM. By incorporating geometric corrections and simulation-informed bias mitigation, we obtained a robust mass estimate for the LG that reconciles differences between traditional virial methods, TAs, and simulation-based approaches. Moreover, we tested how the minor and major infall models from MW-like galaxies change the mass prediction for the VT. Based on the predictions from these two models, we obtained a robust virial mass estimate.
This paper is structured as follows: Section 2 introduces the theoretical foundation for virial mass estimation and details the assumptions underlying the different infall models. Section 3 presents the implementation of these models within the TNG50. simulation and the development of bias corrections. In Sect. 4 we apply our methodology to the observational data on LG dwarf galaxies. Section 5 discusses the results in the broader context of galaxy group dynamics and cosmological expectations.
2. Theory
2.1. Relative motion and infall models
To investigate the dynamics of galaxy pairs within the LG, we first converted observed velocities into the CoM frame. The physical separation, rgc, between two galaxies was determined from their angular separation, θ, on the sky and their distances, rg and rc, from the observer (see Fig. 2):
(see Fig. 2). Due to observational constraints, only the LoS velocity components, vLoS, can be measured directly; the other direction, v⊥, remains largely unconstrained. As such, inferring the true radial infall velocity relative to the LG’s CoM requires assumptions about the unobserved components. Below, we present two limiting models for estimating these infall velocities, following Karachentsev & Kashibadze (2006) and the updated interpretation in Wagner & Benisty (2025).
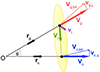 |
Fig. 2. Relative motion of two galaxies. The position vectors r1 and r2 (with distances rg and rc from the observer) form an angle θ. Velocity vectors v1 and v2 include both radial and tangential components, though only their LoS projections are directly observable. |
The minor infall model treats the galaxy and the CoM symmetrically and assumes that both have vanishing tangential velocities, v⊥, c = v⊥, g = 0. The estimated radial infall velocity, vr, min, of the galaxy toward the CoM is
where vc and vj are the LoS velocities of the CoM and the galaxy, respectively, and θc, j is the angular separation between the center and the galaxy. This model assumes negligible non-radial motion, which is plausible for a statistical ensemble. Nevertheless, it could break down in finely tuned individual systems (Wagner & Benisty 2025).
In contrast, the major infall model adopts an asymmetric formulation by projecting the velocity difference between the galaxy and the CoM onto their separation vector. Assuming vanishing transverse motion, vt = 0, the inferred radial infall velocity is
This model emphasizes the relative velocity component along the direct line connecting the galaxy to the CoM and implicitly neglects any perpendicular contributions. Both infall models assume that galaxies act as equal-mass tracers of the LG’s mass distribution. Their contrasting assumptions bracket the range of plausible radial velocities, providing upper and lower bounds that, when combined with VT estimates, help constrain the total mass of the LG.
2.2. The virial theorem
The VT provides a powerful tool for estimating the gravitational mass of a system using kinematic tracers (Limber & Mathews 1960; Bahcall & Tremaine 1981; Heisler et al. 1985; An & Evans 2011; Tully 2015; Benisty et al. 2024). Let us consider a system of N test particles (e.g., satellite galaxies or halo stars) with positions ri and velocities vi orbiting in a gravitational potential generated by an unseen mass distribution. In such cases, observational limitations often restrict measurements to projected positions and LoS velocities, necessitating simplified mass estimators. The VT,
gives
where fVT encapsulates assumptions about the tracer geometry and potential, σv is the 1D velocity dispersion, and rG represents a characteristic 3D gravitational radius derived from the 3D.
Application of the VT to observational data requires a careful consideration of projection effects. When only LoS velocities and projected distances are available, the 3D estimator adapts by introducing a geometric correction. For a spherically symmetric system with isotropic velocities and sufficient tracers, the virial mass becomes
where RG is the projected gravitational radius and σv, los is the dispersion of the LoS velocity. This replaces the 3D rG with the projected RG and the radial velocity dispersion.
The LG deviates from this idealized scenario. Dominated by the MW and M31, its binary mass distribution and anisotropic tracer population preclude the use of standard spherical corrections. Furthermore, the limited number of tracers and their asymmetric distribution around two centers (rather than a single halo) violate the assumptions behind the projected virial formula. To address this, cosmological simulations replicating the LG’s unique configuration are used to calibrate the factor fVT, thereby accounting for its nontrivial geometry and dynamical interactions. Thus, the virial mass estimate combines observed velocities and distances with simulation-derived adjustments to mitigate biases. To assess the role of dark matter in galaxy groups, we modeled these systems as being dominated by one or two giant galaxies (masses M1 and M2) with N remote tracer galaxies of average mass m. If we neglect the self-gravity of the tracers, the giant galaxies dominate the gravitational potential energy:
Here, r1G and r2G are scale lengths inversely proportional to the tracers’ mean distances from M1 and M2, respectively, and are defined as
where ri0 denotes the distance of the i-th tracer to the giant galaxies’ CoM. Applying the VT, we modified Eq. (5) to
where γ = MMW/MTot is the mass ratio and M = M1 + M2 is the total mass. By adopting mass ratios, γ, inferred from observations (e.g., γ = 0.7 for MW-M31), we can determine the total mass from σv and the tracers’ spatial distribution.
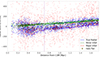 |
Fig. 3. Radial velocity distribution for an isolated galaxy pair in TNG50. Velocities relative to the CoM reveal anisotropic kinematics: minor infall motions (in blue) show suppressed dispersion, while major infall velocities (in red) reflect orbital dynamics. Distances are normalized to the pair separation. |
3. Cosmological simulation
The cosmological magnetohydrodynamic simulations analyzed in this work were drawn from the IllustrisTNG project (Vogelsberger et al. 2014; Nelson et al. 2015). We specifically used the TNG50 run (Nelson et al. 2019; Pillepich et al. 2019). This simulation models a ΛCDM universe in a periodic box of side length 51.7 Mpc with sufficient resolution to resolve galaxy-scale dynamics. The simulation adopts cosmological parameters consistent with Planck 2018 results (Planck Collaboration VI 2020). To identify LG-like systems, we selected isolated galaxy pairs from TNG50 using the zero-velocity surface criteria from Sandage (1986). For a halo pair with a total mass M, the turnaround radius, rta, is defined as the boundary at which inward peculiar velocities balance the Hubble expansion. This radius is calculated via
where tU is the age of the Universe. Pairs are considered isolated if there are no other halos with M > 1010 M⊙ within rta. This ensures dynamical isolation akin to the LG, where the MW and M31 dominate the local mass distribution. Candidate pairs are further filtered by the mass ratio γ ∈ [0.5, 1.2] and the separation r ∈ [0.5, 1.2] Mpc, mirroring the MW-M31 configuration. For each selected pair, we converted the perspective of an observer located at the least massive galaxy (the MW-type) to the CoM frame of the pair, taking the minor and major infall from the MW-like halo into consideration.
Figure 3 compares the radial velocity distributions predicted by the minor and major infall models with the true velocities for a representative pair. Neither model reproduces the exact radial velocity toward the CoM, and the two yield distinct distributions: the minor infall model a narrower spread and the major infall model a broader distribution relative to the true velocities. These differences are quantified in Fig. 4, which shows the velocity dispersion profiles of bound subhalos for both models. The minor infall model systematically underestimates the velocity dispersion (biased low), whereas the major infall model overestimates it (biased high). These opposing biases suggest that the true mass lies between the estimates derived from the two models.
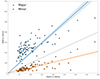 |
Fig. 4. Velocity dispersions of bound subhalos around the pair based on the minor and major infall models vs. the true radial velocity. |
The velocity anisotropy – deviations from isotropic orbital motions – necessitates a geometric correction factor, fVT, to reconcile VT predictions with observations. Applying the VT to dwarf galaxies with known enclosed masses within the turnaround radius, we calculated fVT for each infall scenario (see Fig. 5). We find that the major infall model’s overestimated dispersion, σv, requires a correction factor of fVT, Maj = 0.7 to match the true mass, MTrue. Conversely, the minor infall model’s underestimated dispersion requires a significantly larger correction factor of fVT, Min = 16.8. This stark contrast highlights the minor model’s poor agreement with observations without correction, whereas the major model aligns more closely with expectations. Both corrections are consistent with analytic models for isolated halos, underscoring the sensitivity of virial mass estimates to velocity anisotropy.
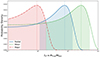 |
Fig. 5. Probability density distributions of the VT correction factor fVT ≡ MTrue/MDyn (where MDyn ≡ σv2rG/G), calibrated using the TNG50 simulation. The curves correspond to three dynamical models: radial (using uncorrected velocity projection), minor infall, and major infall. The peaks reflect the optimal correction factors derived from simulation ensembles, with widths indicating uncertainties in velocity anisotropy modeling. |
4. LG dwarf galaxy data
Incorporating a comprehensive dataset1 compiled from McConnachie (2012), McConnachie & Venn (2020a,b), and Tully et al. (2023), we analyzed the dwarf galaxies within a 3 Mpc radius around the LG (see Fig. 1). To determine the LG’s CoM, we adopted the observed separation and radial velocity between the MW and M31 from van der Marel et al. (2012). The CoM was assumed to lie along the line connecting the MW and M31, with its precise location set by the mass ratio MMW/MLG. Following Diaz et al. (2014), we adopted γ = 0.7, which is also in line with recent dynamical studies of the LG. Figure 6 illustrates the radial velocity–distance relation for the galaxies in our sample. The upper panel shows LoS velocities relative to the MW, which deviate significantly from the linear Hubble flow, reflecting the gravitational influence of the LG. Converting velocities to the LG CoM frame (lower panel) using the minor and major infall models yields a distribution that aligns more clearly with expectations from infall models, particularly within the turnaround radius of approximately 1 Mpc. Within this region, two dominant populations emerge: bound satellites of the MW (in blue) and M31 (in red). Beyond the turnaround radius, the galaxies transition to the Hubble flow regime, highlighting the balance between gravitational collapse and cosmological expansion.
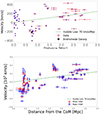 |
Fig. 6. Upper: LoS velocity vs. distance from the MW. Nearby galaxies (black points) exhibit deviations from the Hubble law (dashed green line). Lower: Radial velocity vs. distance from the CoM. Velocities have been converted to the CoM frame using γ = 0.7. The bounded region (< 1 Mpc) contains the MW (in blue) and M31 (in red) satellites. |
To estimate the LG’s dynamical mass, we examined galaxy velocity dispersions along the principal infall axes. For the minor infall, characterized by suppressed vertical motions, we measure a velocity dispersion of 133.44 ± 29.76 km/s. For the major-axis infall, dominated by orbital streaming, the dispersion increases to 178.67 ± 36.21 km/s. Adopting a gravitational radius of rG = 210 ± 10 kpc, we applied the VT to infer the enclosed dynamical masses. Using the minor infall dispersion, the virial mass is

while the major infall analysis yields

These estimates span a range consistent with anisotropic infall models; in this models, projection effects and tracer contamination can bias the inferred mass depending on the viewing infall. Using the correction factors probed by the simulation, we marginalized the LG mass to

which also agrees with the theoretical expectation from the maximum turnaround radius, derived via the velocity surface estimate from Karachentsev et al. (2009).
The virial mass estimate of MLG = (2.5 ± 0.4)×1012 M⊙ derived by Diaz et al. (2014) aligns closely with our minor infall model prediction (MMin = 2.55 × 10¹² M⊙). While Diaz et al. (2014) did not explicitly frame their analysis in terms of minor infall, their methodology – projecting LoS velocities onto the axis connecting individual galaxies to the LG’s CoM – is a hallmark of the minor infall approximation. This approach systematically underestimates the total mass by excluding unobserved velocity components perpendicular to the CoM-galaxy line. In contrast, our major infall model, which interprets LoS velocities under the assumption of purely radial motion relative to the CoM, yields a significantly higher mass (MMaj = 4.56 × 10¹² M⊙). By calibrating these extremes against TNG50 simulations, we reconciled the two regimes into a unified mass estimate (MLG = 2.99 × 10¹² M⊙), resolving prior inconsistencies and underscoring the critical role of velocity projection corrections in dynamical studies.
5. Discussion and conclusion
By analyzing the LG mass budget through cosmological simulations, we tested the validity of VT estimators based on minor and major infall models. These models reflect distinct geometric anisotropies in the velocity distribution of dwarf galaxies. The minor infall model, which suppresses vertical motions akin to minor-axis kinematics, systematically underestimates the total mass (M ∼ 2.5 × 10¹² M⊙) due to incomplete sampling of the velocity dispersion. Conversely, the major infall model, which incorporates broader velocity distributions aligned with the major axis, overestimates the mass (M ∼ 5 × 10¹² M⊙) because it includes unbound tracers. To reconcile these biases, we derived geometric correction factors that scale the velocity dispersions to match the true enclosed mass. Our fiducial estimate of MLG = 3 × 10¹² M⊙ lies between the two extremes and aligns with independent methods, resolving the tension inherent in traditional VT-based approaches.
The fiducial mass also agrees with (1) the TA for the MW–M31 orbit, according to which M ∼ 2.5 − 3.2 × 10¹² M⊙ (van der Marel et al. 2012; Garrison-Kimmel et al. 2014; Partridge et al. 2013; Benisty 2024), and (2) the Hubble flow fit (Karachentsev et al. 2009; Peñarrubia et al. 2014) and the projected mass method, which find (2.34 ± 0.41)×1012 M⊙ (Makarov et al. 2025). Although the latter yield a slightly lower, biased mass estimate of ∼2 × 10¹² M⊙, this remains consistent with our result within the uncertainties. Broadly, the LG mass estimates center around 3 × 10¹² M⊙, with rotation curve studies of the MW and M31 (Nesti & Salucci 2013; Wang et al. 2020; Bobylev & Bajkova 2023) indicating total masses in the range [2.8 − 3.3]×1012 M⊙. Independent mass estimates for the MW ([0.9 − 1.3]×1012 M⊙; Lopez Fune et al. 2017; Wang et al. 2020) and M31 ([1.0 − 2.0]×1012 M⊙; Nesti & Salucci 2013; Sawala et al. 2023a) also support a total mass range of [1.9 − 3.5]×1012 M⊙, as illustrated in Fig. 7. The remaining scatter likely arises from systematics, such as incomplete tracer samples, nonequilibrium dynamics, and the asymmetric mass distribution of the LG, which affect the virial mass estimation factor.
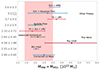 |
Fig. 7. Estimates of the total mass of the LG using various methods. The bottom three represent new estimates based on an anisotropic infall analysis: a corrected LG mass incorporating projection effects (2.99 ± 0.60 × 10¹² M⊙), a minor infall direction (2.55 ± 0.14 × 10¹² M⊙), and a major infall direction (4.56 ± 1.86 × 10¹² M⊙). These are followed by the balanced momentum method and a revised TA with ä/a and LMC correction. The top four include alternative probes such as the Hubble flow, the TA with Gaussian processes, and artificial neural networks. The shaded red band highlights the range [1.9 − 3.5]×1012 M⊙, which is consistent with multiple independent analyses. The other probes were taken from Diaz et al. (2014), Peñarrubia et al. (2014), Benisty et al. (2022), Benisty (2024), McLeod et al. (2017), and Sawala et al. (2023a,b). |
Future progress will require precise proper motions from missions like Gaia DR4-5 and JWST (McConnachie & Venn 2020b; Gaia Collaboration 2023). Our findings underscore the necessity of geometric corrections in VT applications and provide a framework for studying anisotropic systems beyond the LG. The LG’s total mass is robustly constrained to 3 × 10¹² M⊙, a value that harmonizes methodological discrepancies, aligns with ΛCDM predictions, and cements the LG’s role as a cornerstone for testing galaxy formation and dark matter models on group scales (Salucci 2019).
Acknowledgments
DB is supported by a Minerva Fellowship of the Minerva Stiftung Gesellschaft für die Forschung mbH. DFM thanks the Research Council of Norway for their support and the resources provided by UNINETT Sigma2 – the National Infrastructure for High-Performance Computing and Data Storage in Norway.
References
- An, J. H., & Evans, N. W. 2011, MNRAS, 413, 1744 [Google Scholar]
- Bahcall, J. N., & Tremaine, S. 1981, ApJ, 244, 805 [Google Scholar]
- Benisty, D. 2024, A&A, 689, L1 [NASA ADS] [CrossRef] [EDP Sciences] [Google Scholar]
- Benisty, D., & Capozziello, S. 2023, Phys. Dark Univ., 39, 101175 [Google Scholar]
- Benisty, D., & Davis, A.-C. 2022, Phys. Rev. D, 105, 024052 [NASA ADS] [CrossRef] [Google Scholar]
- Benisty, D., Vasiliev, E., Evans, N. W., et al. 2022, ApJ, 928, L5 [NASA ADS] [CrossRef] [Google Scholar]
- Benisty, D., Chaichian, M. M., & Tureanu, A. 2024, Phys. Lett. B, 858, 139033 [Google Scholar]
- Bobylev, V. V., & Bajkova, A. T. 2023, Publ. Pulkovo Obs., 228, 57 [Google Scholar]
- Chamberlain, K., Price-Whelan, A. M., Besla, G., et al. 2023, ApJ, 942, 18 [CrossRef] [Google Scholar]
- Diaz, J. D., Koposov, S. E., Irwin, M., Belokurov, V., & Evans, N. W. 2014, MNRAS, 443, 1688 [CrossRef] [Google Scholar]
- Gaia Collaboration (Vallenari, A., et al.) 2023, A&A, 674, A1 [NASA ADS] [CrossRef] [EDP Sciences] [Google Scholar]
- Garrison-Kimmel, S., Boylan-Kolchin, M., Bullock, J. S., & Kirby, E. N. 2014, MNRAS, 444, 222 [NASA ADS] [CrossRef] [Google Scholar]
- Hartl, O. V., & Strigari, L. E. 2022, MNRAS, 511, 6193 [CrossRef] [Google Scholar]
- Hartl, O. V., & Strigari, L. E. 2025, MNRAS, 539, 160 [Google Scholar]
- Heisler, J., Tremaine, S., & Bahcall, J. N. 1985, ApJ, 298, 8 [CrossRef] [Google Scholar]
- Karachentsev, I. D., & Kashibadze, O. G. 2006, Astrophysics, 49, 3 [NASA ADS] [CrossRef] [Google Scholar]
- Karachentsev, I. D., Tully, R. B., Dolphin, A., et al. 2007, AJ, 133, 504 [NASA ADS] [CrossRef] [Google Scholar]
- Karachentsev, I. D., Kashibadze, O. G., Makarov, D. I., & Tully, R. B. 2009, MNRAS, 393, 1265 [NASA ADS] [CrossRef] [Google Scholar]
- Lemos, P., Jeffrey, N., Whiteway, L., et al. 2021, Phys. Rev. D, 103, 023009 [NASA ADS] [CrossRef] [Google Scholar]
- Li, Y.-S., & White, S. D. M. 2008, MNRAS, 384, 1459 [CrossRef] [Google Scholar]
- Limber, D. N., & Mathews, W. G. 1960, ApJ, 132, 286 [NASA ADS] [CrossRef] [Google Scholar]
- Lopez Fune, E., Salucci, P., & Corbelli, E. 2017, MNRAS, 468, 147 [Google Scholar]
- Makarov, D., Makarov, D., Kozyrev, K., & Libeskind, N. 2025, Universe, 11, 144 [Google Scholar]
- McConnachie, A. W. 2012, AJ, 144, 4 [Google Scholar]
- McConnachie, A. W., & Venn, K. A. 2020a, AJ, 160, 124 [Google Scholar]
- McConnachie, A. W., & Venn, K. A. 2020b, Res. Notes Am. Astron. Soc., 4, 229 [Google Scholar]
- McLeod, M., & Lahav, O. 2020, JCAP, 09, 056 [Google Scholar]
- McLeod, M., Libeskind, N., Lahav, O., & Hoffman, Y. 2017, JCAP, 12, 034 [CrossRef] [Google Scholar]
- Nelson, D., Pillepich, A., Genel, S., et al. 2015, Astron. Comput., 13, 12 [Google Scholar]
- Nelson, D., Pillepich, A., Springel, V., et al. 2019, MNRAS, 490, 3234 [Google Scholar]
- Nesti, F., & Salucci, P. 2013, JCAP, 07, 016 [Google Scholar]
- Partridge, C., Lahav, O., & Hoffman, Y. 2013, MNRAS, 436, 45 [Google Scholar]
- Peñarrubia, J., Ma, Y.-Z., Walker, M. G., & McConnachie, A. 2014, MNRAS, 443, 2204 [Google Scholar]
- Peñarrubia, J., Gómez, F. A., Besla, G., Erkal, D., & Ma, Y.-Z. 2016, MNRAS, 456, L54 [CrossRef] [Google Scholar]
- Pillepich, A., Nelson, D., Springel, V., et al. 2019, MNRAS, 490, 3196 [Google Scholar]
- Planck Collaboration VI. 2020, A&A, 641, A6; Erratum: A&A 652, C4 (2021) [NASA ADS] [CrossRef] [EDP Sciences] [Google Scholar]
- Salucci, P. 2019, A&ARv, 27, 2 [NASA ADS] [CrossRef] [Google Scholar]
- Sandage, A. 1986, ApJ, 307, 1 [NASA ADS] [CrossRef] [Google Scholar]
- Sawala, T., Teeriaho, M., & Johansson, P. H. 2023a, MNRAS, 521, 4863 [NASA ADS] [CrossRef] [Google Scholar]
- Sawala, T., Peñarrubia, J., Liao, S., & Johansson, P. H. 2023b, MNRAS, 526, L77 [NASA ADS] [CrossRef] [Google Scholar]
- Tully, R. B. 2015, AJ, 149, 54 [NASA ADS] [CrossRef] [Google Scholar]
- Tully, R. B., Kourkchi, E., Courtois, H. M., et al. 2023, ApJ, 944, 94 [NASA ADS] [CrossRef] [Google Scholar]
- van den Bergh, S. 1999, A&ARv, 9, 273 [NASA ADS] [CrossRef] [Google Scholar]
- van der Marel, R. P., & Guhathakurta, P. 2008, ApJ, 678, 187 [CrossRef] [Google Scholar]
- van der Marel, R. P., Fardal, M., Besla, G., et al. 2012, ApJ, 753, 8 [NASA ADS] [CrossRef] [Google Scholar]
- Vogelsberger, M., Genel, S., Springel, V., et al. 2014, Nature, 509, 177 [Google Scholar]
- Wagner, J., & Benisty, D. 2025, A&A, submitted [arXiv:2501.13149] [Google Scholar]
- Wang, W., Han, J., Cautun, M., Li, Z., & Ishigaki, M. N. 2020, Sci. China Phys. Mech. Astron., 63, 109801 [NASA ADS] [CrossRef] [Google Scholar]
- Wempe, E., Lavaux, G., White, S. D. M., et al. 2024, A&A, 691, A348 [NASA ADS] [CrossRef] [EDP Sciences] [Google Scholar]
All Figures
|
Fig. 1. Distribution of LG dwarf galaxies. The sample includes MW and M31 satellites along with isolated galaxies within 4 Mpc, all of which serve as tracers of LG dynamics. The data are taken from McConnachie & Venn (2020a,b). |
| In the text | |
|
Fig. 2. Relative motion of two galaxies. The position vectors r1 and r2 (with distances rg and rc from the observer) form an angle θ. Velocity vectors v1 and v2 include both radial and tangential components, though only their LoS projections are directly observable. |
| In the text | |
|
Fig. 3. Radial velocity distribution for an isolated galaxy pair in TNG50. Velocities relative to the CoM reveal anisotropic kinematics: minor infall motions (in blue) show suppressed dispersion, while major infall velocities (in red) reflect orbital dynamics. Distances are normalized to the pair separation. |
| In the text | |
|
Fig. 4. Velocity dispersions of bound subhalos around the pair based on the minor and major infall models vs. the true radial velocity. |
| In the text | |
|
Fig. 5. Probability density distributions of the VT correction factor fVT ≡ MTrue/MDyn (where MDyn ≡ σv2rG/G), calibrated using the TNG50 simulation. The curves correspond to three dynamical models: radial (using uncorrected velocity projection), minor infall, and major infall. The peaks reflect the optimal correction factors derived from simulation ensembles, with widths indicating uncertainties in velocity anisotropy modeling. |
| In the text | |
|
Fig. 6. Upper: LoS velocity vs. distance from the MW. Nearby galaxies (black points) exhibit deviations from the Hubble law (dashed green line). Lower: Radial velocity vs. distance from the CoM. Velocities have been converted to the CoM frame using γ = 0.7. The bounded region (< 1 Mpc) contains the MW (in blue) and M31 (in red) satellites. |
| In the text | |
|
Fig. 7. Estimates of the total mass of the LG using various methods. The bottom three represent new estimates based on an anisotropic infall analysis: a corrected LG mass incorporating projection effects (2.99 ± 0.60 × 10¹² M⊙), a minor infall direction (2.55 ± 0.14 × 10¹² M⊙), and a major infall direction (4.56 ± 1.86 × 10¹² M⊙). These are followed by the balanced momentum method and a revised TA with ä/a and LMC correction. The top four include alternative probes such as the Hubble flow, the TA with Gaussian processes, and artificial neural networks. The shaded red band highlights the range [1.9 − 3.5]×1012 M⊙, which is consistent with multiple independent analyses. The other probes were taken from Diaz et al. (2014), Peñarrubia et al. (2014), Benisty et al. (2022), Benisty (2024), McLeod et al. (2017), and Sawala et al. (2023a,b). |
| In the text | |
Current usage metrics show cumulative count of Article Views (full-text article views including HTML views, PDF and ePub downloads, according to the available data) and Abstracts Views on Vision4Press platform.
Data correspond to usage on the plateform after 2015. The current usage metrics is available 48-96 hours after online publication and is updated daily on week days.
Initial download of the metrics may take a while.