Fig. 5.
Download original image
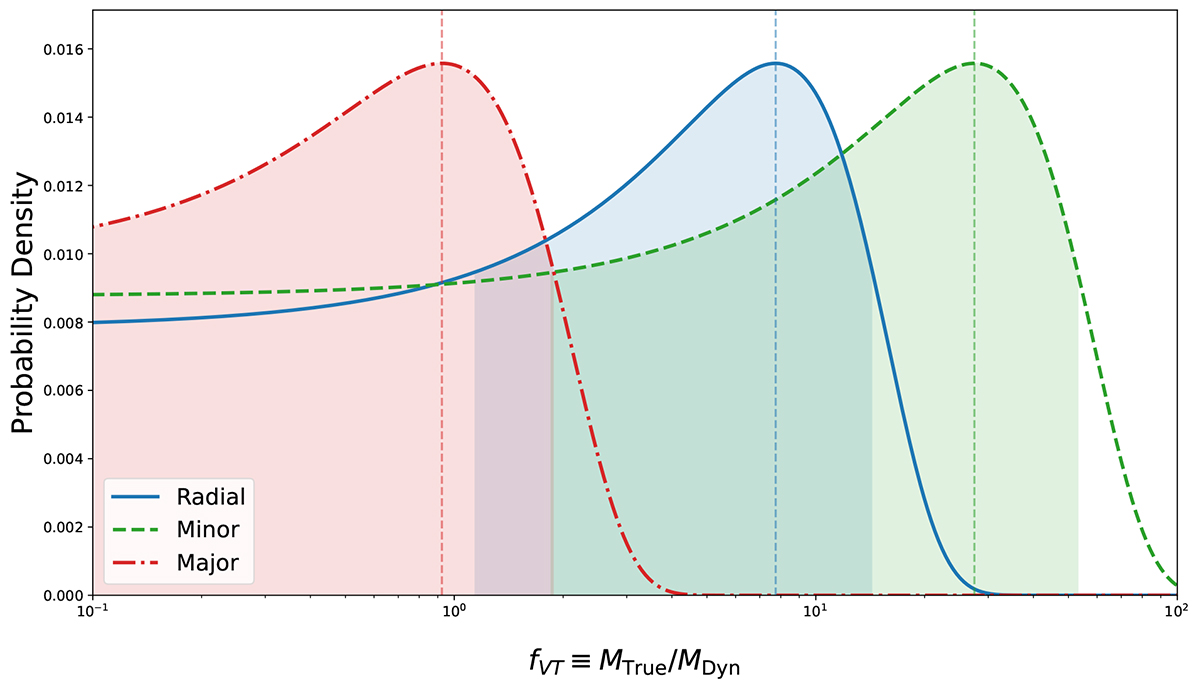
Probability density distributions of the VT correction factor fVT ≡ MTrue/MDyn (where MDyn ≡ σv2rG/G), calibrated using the TNG50 simulation. The curves correspond to three dynamical models: radial (using uncorrected velocity projection), minor infall, and major infall. The peaks reflect the optimal correction factors derived from simulation ensembles, with widths indicating uncertainties in velocity anisotropy modeling.
Current usage metrics show cumulative count of Article Views (full-text article views including HTML views, PDF and ePub downloads, according to the available data) and Abstracts Views on Vision4Press platform.
Data correspond to usage on the plateform after 2015. The current usage metrics is available 48-96 hours after online publication and is updated daily on week days.
Initial download of the metrics may take a while.