| Issue |
A&A
Volume 689, September 2024
|
|
|---|---|---|
| Article Number | L1 | |
| Number of page(s) | 5 | |
| Section | Letters to the Editor | |
| DOI | https://doi.org/10.1051/0004-6361/202449884 | |
| Published online | 30 August 2024 | |
Letter to the Editor
Weighing Milky Way and Andromeda in an expanding ΛCDM Universe
Decreasing the Local Group mass
1
Frankfurt Institute for Advanced Studies (FIAS), Ruth-Moufang-Strasse 1, 60438 Frankfurt am Main, Germany
2
Helsinki Institute of Physics (HIP), PO Box 64 00014 University of Helsinki, Finland
Received:
6
March
2024
Accepted:
19
August
2024
The dynamics of the Local Group (LG), especially the contribution of the Milky Way (MW) and Andromeda (M 31) galaxies, is sensitive to the presence of dark energy. This work analyzes the evolution of the LG by considering it as a two-body problem in a homogeneous and isotropic expanding spacetime in a full Λcold dark matter (ΛCDM) background. Using the timing argument (TA), which links LG dynamics to LG mass, we find that the full ΛCDM background predicts a ∼10% lower mass for the LG; whereas Λ alone predicts a ∼10% higher mass. The TA mass is modified by (i) simulations and (ii) the effect of the Large Magellanic Cloud (LMC) to alleviate the poorly constrained internal mass distributions of M 31 and the MW, their time evolution, and the unknown distribution of dark matter between them. First, using IllustrisTNG simulations, we accounted for the effects of two extended halos and their environment (rather than point particles) and predicted their mass (3.89 ± 0.62)×1012 M⊙. Second, the LMC effectively changes the separation and velocities of M 31 towards the MW and reduces the predicted mass to (2.33 ± 0.72)×1012 M⊙. Despite the uncertainties around dark matter between these galaxies, the overall estimated mass is compatible with the mere sum of the MW and M 31 masses. The total mass of the TA is compatible with other estimates, such as the Hubble flow and the Virial Theorem with other dwarf galaxies. The combined result shows, for the first time, that a lower mass estimate can be obtained from the TA, with a consistent embedding and other systematic effects, and without an additional dark matter halo around the galaxies.
Key words: galaxies: dwarf / galaxies: evolution / Local Group / dark energy
© The Authors 2024
 Open Access article, published by EDP Sciences, under the terms of the Creative Commons Attribution License (https://creativecommons.org/licenses/by/4.0), which permits unrestricted use, distribution, and reproduction in any medium, provided the original work is properly cited.
This article is published in open access under the Subscribe to Open model. Subscribe to A&A to support open access publication.
1. Introduction
Dark energy is an unknown type of energy that influences the universe on its largest scales (Peebles & Ratra 2003). Beyond its impact on large scales, dark energy exerts a significant influence on the Local Universe (Chernin et al. 2004, 2006, 2015; Peirani & Pacheco 2008; Karachentsev et al. 2009). The cosmological constant (Λ) alters the predicted mass of the LG of galaxies, assuming that it consists mainly of MW and M 31, which form a two-body system (Chernin et al. 2009; Partridge et al. 2013). An elegant approach to inferring the total mass of the LG is the timing argument (TA), which connects the observed kinematics of the LG to the LG mass (Kahn & Woltjer 1959; Lynden-Bell 1981; Raychaudhury & Lynden-Bell 1989; Sawala et al. 2023a). This argument assumes that the present system is on its first encounter in a two-body orbit that has been continuously expanding from the Big Bang until now. Initially, only assuming a radial velocity, the TA has since been extended to include eccentricity (Li & White 2008) and the recoil velocity of the MW with respect to the LMC (Chamberlain et al. 2023; Benisty et al. 2022). However, the estimated mass of the TA is upwardly biased (about [4 − 6]×1012 M⊙), compared to other estimates (see Section 2 and Fig. 1 in Sawala et al. 2023b, where an overview of different estimates is given).
A non-trivial effect of the LG is the repulsion effect of Λ. The TA mass is predicted to be about 10% higher in the presence of Λ (Partridge et al. 2013) due to a constant repulsion force that needs to be compensated for by a higher mass and a higher Newtonian attraction force. This Letter demonstrates that including the complete history of Λcold dark matter (ΛCDM) predicts a 10% lower mass than the TA mass since, in earlier times, the embedding endowed it with a force of attraction. With simulation calibration and the effect of LMC, we show, for the first time, that it is possible to achieve a total mass of the LG (2.33 ± 0.72)×1012 M⊙, which is lower then the previous TA mass estimates.
The structure of the Letter is as follows: Section 2 details the different embedding spacetime. Section 3 presents a discussion of the different effects included in estimating the mass (i) embedding spacetime, (ii) simulation calibration, and (iii) inclusion of the LMC. Section 4 gives the different mass estimates, along with the various related effects and a comparison of the masses with other masses in the literature.
2. Embedding spacetime
The spacetime that approximates the two-body problem can be written as a test body of reduced mass in a gravitational potential embedded in two possible background metrics:
(i) De Sitter-Schwarzschild (dSS) metric takes a spherical-symmetric form where only Λ drives the expansion:  with the potential Φ = 2GM/(rc2)+Λr2/6. A test particle in the dSS metric at the low-energy limit (Φ ≪ 1) obeys the equation of motion (EoM):
![$$ \begin{aligned} \ddot{r}/r = -GM/r^3 + [l/r^2]^2+ \Omega _{\Lambda } H_0^2, \end{aligned} $$](/articles/aa/full_html/2024/09/aa49884-24/aa49884-24-eq2.gif)
where r is the separation, M is the total mass of the binary system, G is the Newtonian gravitational constant, and c is the speed of light, while l is the conserved angular momentum over the reduced mass. Here, Λ is connected to the cosmological parameters via:  , where ΩΛ is the dark energy rate and H0 is the Hubble parameter, which is 67.4 ± 0.5 km/s/Mpc from the Planck Collaboration (Planck Collaboration VI 2020).
(ii) McVittie (McV) metric describes a massive object immersed in an expanding cosmological spacetime (McVittie 1933; Kaloper et al. 2010) and the full ΛCDM model impacts the binary motion. The metric is expressed as: ds2 = −(1 − ΦN) dt2 + a(t)2dr2/(1 − ΦN) + a(t)2r2 dΩ2, where a(t) is the scale factor of the universe and ΦN = 2GM/(rc2). In the low-energy limit (ΦN ≪ 1 and rH(t)≪1), the equation of motion is expressed as (Sereno & Jetzer 2007; Faraoni & Jacques 2007; Nandra et al. 2012):
![$$ \begin{aligned} \ddot{r}/r = -GM/r^3 + [l/r^2]^2 + \ddot{a}/a. \end{aligned} $$](/articles/aa/full_html/2024/09/aa49884-24/aa49884-24-eq4.gif)
The main difference between the two descriptions is, thus, the Λc2/3 vs. ä/a term in Eqs. (1) and (2). Figure 1 displays the ratio between these two contributions over the cosmic time, assuming the ΛCDM model. While Λc2/3 remains constant, for z > 0.67, the ratio of ä/a acts as an attractive force. This work shows that these two different embedding yield different LG masses. Thus, only based on the LG mass and dynamics, we show that ä/a describes the LG history more consistently. The critical time for the dSS is about 35 Gyr and for the McV is the age of the Universe (Benisty et al. 2024).
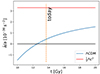 |
Fig. 1. Ratio between ä/a and Λc2/3 vs. time assuming the ΛCDM model. Asymptotically, both models approach the same value. For the ä/a case, the expansion rate of the Universe creates an attractive force at early times and only becomes repulsive at late times. |
The peculiar motion of M 31 is added to the Hubble expansion via the known relations:  , where vLoS is the line of sight velocity, vpec is the projected peculiar velocity on the line of sight direction, and r0 is the distance from MW to M 31. This relation could be obtained by integrating Eq. (2) over time, which shows that ä/a is consistent from a theoretical point of view. However, to describe the complete motion of the M 31, it is necessary to include the tangential velocity.
3. Timing argument (TA) and other effects
3.1. Timing argument mass
The TA mass is numerically calculated for the separation and the chosen velocities. We can numerically solve Eq. (1) or Eq. (2) by integrating backwards in time to the Big Bang, where the age of the Universe for ΛCDM is:
The separation and the radial velocity of M 31 from the MW are known from van der Marel et al. (2012): r0 = 0.77 ± 0.04 Mpc and vrad = 109.3 ± 4.4 km/s. However, there are different inferred tangential velocities based on the galaxies proper motion (PM): Using only HST PM, van der Marel et al. (2012) reported vtan = 17 ± 17 km/s, which implies the classical infall model. Later, combining HST and Gaia DR2 PM, van der Marel et al. (2019) found a somewhat higher value and measure  km/s. This measurement includes a weighted average of an HST-only value of
  km/s. Salomon et al. (2021) measure dvtan = 82.4 ± 31.2 km/s using Gaia-DR3 PM of blue main-sequence stars in M 31. We chose the value of vtan = 57 ± 35 km/s because it is similar to the combined result of HST and Gaia, as in van der Marel et al. (2019).
Figure 2 shows the separation of LG-like systems for different background models: a purely Newtonian model, adding the cosmological constant correction Λ (dSS) and the embedding in an expanding ΛCDM Universe ä/a (McV). The best solution for minimal separation indicates the TA mass MTA. The predicted TA mass from Λ (∼5 × 10¹² M⊙) is higher than the one coming from the purely Newtonian model (∼4.6 × 10¹² M⊙), since it’s necessary to overcome the repulsion force of Λ via stronger Newtonian attraction. The ä/a model yields the lowest mass (∼4 × 10¹² M⊙), since the ä/a acts as an attractive force at early times, thus less gravitational attraction (via mass) is needed.
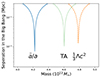 |
Fig. 2. Separation at the Big Bang between MW and M 31 for different forces. The minima identify the TA masses, since they satisfy the condition of r[t = 0] = 0. The TA mass for the Λ embedding is higher mass then the Newtonian TA, and the ä/a embedded mass is the lowest one. |
The Hubble parameter enters both in the propagation of the separation at the Big Bang (the age of the Universe from Eq. (3)) and also for the force coming from the embedding. Figure 3 shows the dependence between the predicted mass based on the TA versus the age of the Universe (left) and versus the value of the Hubble parameter H0 (right). For a higher age of the Universe, the predicted TA mass is lower, and for larger H0 the TA mass is higher. For all of these cases, the TA + Λ mass is the highest and the TA + ä/a mass is the lowest one. For the same mass, the age of the Universe predicted by McV would be the higher one, since, systematically, the TA mass from the McV spacetime is the lowest one.
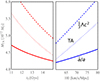 |
Fig. 3. Dependence between the predicted TA mass vs the age of the Universe (left) and vs the value of the Hubble parameter H0 (right), with the mean values of the separation and the radial velocity. For larger Universe ages, the predicted TA mass is lower and for larger H0 the TA mass is higher. The TA + Λ mass is always the highest and the TA + ä/a mass is the lowest one for any H0. |
3.2. Simulation calibration
Owing to simplifications in the TA, the mass estimate may suffer from systematic bias and scatter, for instance: (i) assuming an isolated system with constant total mass, which need not be the case in reality, and (ii) assuming the two galaxies as two point particles, when they are extended halo objects with internal structure dynamics. Li & White (2008) found that the TA mass is unbiased, although it does contain some scatter, by using analogues of the LG pair from the Millenium simulation. However, Gonzalez et al. (2014) noted that the TA mass is only unbiased on average and may be an overestimation if the pairs are restricted to have similar radial and tangential velocities as the virialized MW and M 31 masses.
Therefore, we used the IllustrisTNG N-body and hydrodynamical simulation calibrated by Hartl & Strigari (2022) to address these additional effects, because Hartl & Strigari (2022) found a tendency for the TA mass to be overestimated. We use their sample of ∼600 pairs and by imposing the cuts: (i) r ∈ [650, 950] kpc; (ii) a mass ratio within a factor of 4; (iii) vr ∈ [ − 200, −50] km/s; and (iv) vtan ∈ [50, 200] km/s, so that it resembles the observed distribution of the LG. Figure 4 displays the correlation between the TA mass and the simulation-based mass, with a ratio of P(Mvir/MTA) = 0.82 ± 0.20. For any r, vrad, vtan, we identified the closest matches from the simulated pairs and identified their correction factor, Mvir/MTA, to probe the total virialized mass of the galaxies, Mvir = MMW + M31. Including the calibration of the selected simulated pairs yields a lower mass, namely: (3.89 ± 0.62)×1012 M⊙.
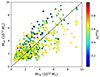 |
Fig. 4. Correlation between the TA mass and the simulation based mass. These ∼600 pairs are selected from the IllustrisTNG cosmological simulation, in which the mass correction factor is computed as the ratio of the virilized halo mass of both galaxies to the mass obtained by the Newtonian TA. The mass ratio is expressed as: Mvir/MTA = 0.82 ± 0.20. |
3.3. Impact of the Large Magellanic Cloud (LMC)
The LMC attracts the center of the MW and perturbs the LG motion. The central region of the MW, including the solar neighborhood, is drawn downward toward the LMC during its pericenter passage, while the outer, slower moving parts remain stationary. Consequently, the observed heliocentric line-of-sight velocity and PM of M 31 are influenced by this downward pull. We aim to correct for this effect.
Peñarrubia et al. (2016) addressed the LMC’s influence by modeling it as a two-point-mass system with the MW assuming that M 31 orbits the barycenter of this combined system. They determined the displacement and velocity shift of the MW relative to the barycenter by multiplying the relative position and velocity of the LMC in the Milky Way-centered frame by the mass ratio of between the LMC mass to the total mass. These corrections need to be subtracted from M 31’s current position and velocity in the Milky Way-centered frame before calculating its trajectory in the barycentric system.
Based on the method that was proposed in Correa Magnus & Vasiliev (2022), Benisty et al. (2022) reevaluated the TA+Sim calibration for the LG mass. This approach first determines the past trajectories of the MW and the LMC under their mutual gravitational influence, using the distance-dependent forces from each galaxy. Then, the orbit of M 31 is integrated backward in time within this time-dependent potential until the LMC perturbation is negligible. From this point, the motion of the binary system only containing MW and M 31 without the LMC is propagated forward to the present time. The resulting separation and velocities of this pure binary system then yield another mass estimate via the TA and the simulation calibration.
Figure 5 shows the posterior distribution of M 31’s Galactocentric radial and the velocity components vrad, vtan, with and without the LMC correction generated in Benisty et al. (2022). Using a prior from van der Marel et al. (2019) results in vtan = 59 ± 34 km/s. Correcting for the LMC perturbation increases vtan by [25 − 30] km/s, changes vrad from −114 ± 1 km/s to −75 ± 15 km/s; it also increases the distance by approximately 40 kpc. Using the modified (r, vrad, vtan) posterior to the LMC change, with the simulation calibration, yields a systematically lower mass (2.33 ± 0.72)×1012 M⊙. For a comparison, the combination for the TA mass with Λ with the LMC and the simulation calibration yields higher predicted mass  (Benisty et al. 2022); however, when including the ä/a embedding instead, we get a mass which is around ∼2 × 10¹² M⊙.
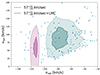 |
Fig. 5. Posterior distribution of values of M 31’s radial and tangential velocity for the Monte Carlo samples generated from the prior on the magnitude of vtan from van der Marel et al. (2019) (purple). After compensating for the LMC perturbation, (Benisty et al. 2022) generates the corresponding vrad and vtan that used here as the modified effect of the LMC (green). The vrad is increased by [25, 30 km/s] and vrad is shifted to −75 ± 15 km/s. |
4. Discussion: LG Mass
Different equations of motion and different histories produce different LG masses. Fig. 6 shows the different predicted masses for the different histories. The ä/a model gives the lowest mass and embedding of Λ requires the largest mass.
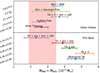 |
Fig. 6. Predicted total mass of the LG of galaxies based on the proper motion of M 31 towards us (TA) with the simulation calibrations. The figure compares masses inferred from different embedding with ä/a vs. pure Λ, and from different methods in the literature: the virial theorem (Diaz et al. 2014), Hubble flow (Peñarrubia et al. 2014), TA + Λ + LMC (Benisty et al. 2022), artificial neural networks on simulated pairs (McLeod et al. 2017), and Gaussian processes on simulated pairs (Sawala et al. 2023b). The red area shows the uniform range MMW + M31 ∈ [1.9, 3.3]×1012 M⊙ which is based on complementary total mass estimate of the MW and M 31 galaxies (Wang et al. 2020; Sawala et al. 2023b). The total LG virialized mass should be higher then the total halo masses. |
Simulations of galaxy pairs predict a lower mass since the simulations take into account the extent of the galaxy halo density instead of assuming point particles (Sawala et al. 2023b). For example, TA predicts [4, 5]×1012 M⊙ and machine learning approaches in simulated pairs predict ∼3 × 10¹² M⊙ (McLeod et al. 2017; Sawala et al. 2023b). One exceptional case is an analysis with a likelihood-free approach, which predicts a broader range for the mass:  with large errors (Lemos et al. 2021). By choosing the ten closest matches from the simulated pairs to the data, the predicted mass reduces to ∼3.5 × 10¹² M⊙. This value is compatible with the machine learning approaches. Including the calibration of the selected simulated pairs yields a lower mass (3.89 ± 0.62)×1012 M⊙.
The TA assumes the total galaxy masses to be constant, while simulations hint at growing galaxy masses over time. There are different studies in the literature to deal with this issue: (i) The Hubble flow method infers the mass by fitting the asymptotic solution of the dwarf galaxies to the velocity distance relation Peñarrubia et al. (2014). (ii) Reference Sawala et al. (2023a) claims that the total enclosed mass between the galaxy pair is invariant over a long history. (iii) In our analysis, the simulated pairs correct for the possible time dependence of the galaxy masses.
The LMC reduces the predicted mass due to the shift of the MW to about ∼2 × 10¹² M⊙, as noted in Peñarrubia et al. (2016), Benisty et al. (2022). Based on the method that was proposed in Correa Magnus & Vasiliev (2022). Benisty et al. (2022) re-evaluated the LG initial conditions with the LMC, by determining the past trajectories of the MW under the gravitational influence of the LMC, integrating M 31 backwards in time within this time-dependent potential until the LMC perturbation is negligible and propagating it forward to the present time. After this double propagation, we get analogous separation and velocities that simulated the MW-M31 without the LMC. The TA for analogous separation and velocities with simulation calibration yields a lower mass (2.33 ± 0.72)×1012 M⊙. For comparison, Benisty et al. (2022) considered the effects of Λ + Sim + LMC and obtained  . In contrast, including ä/a reduces the mass to lower values close to ∼2 × 10¹² M⊙.
This result is compatible with other probes in the literature, which are biased low: (i) the virial theorem of the MW-M31 system with its dwarf galaxies (Diaz et al. 2014; Hartl & Strigari 2022) or (ii) fitting the motions of the dwarf galaxies to the Hubble flow (Peirani & de Freitas Pacheco 2006; Peirani & Pacheco 2008; Karachentsev et al. 2009; Peñarrubia et al. 2014; Teerikorpi & Chernin 2010; Del Popolo & Chan 2022). The result in this Letter reaches a comparable mass only from the MW-M31-LMC, independently of the motions of dwarf galaxies.
The TA is biased high compared to other estimates (see Fig. 6). Sawala et al. (2023a) interpreted the additional mass as the dark matter in between the galaxies motivating by the N-body simulation. In our case, the combination ä/a + Sim + LMC yields a lower mass estimate, which is compatible with Diaz et al. (2014), Peñarrubia et al. (2014, 2016), without accounting for the possible dark matter around the halos. Hence, further analyses to constrain the (not directly detectable) dark matter are required to resolve this issue.
We compared our total mass estimates with the sum of the individual galaxy masses. There are several values for the separate masses of each galaxy in the literature: MMW ∈ [0.9, 1.3]×1012 M⊙ (Wang et al. 2020) and M31 ∈ [1.,2.] × 1012 M⊙ (Sawala et al. 2023b) and references therein. The red area in Fig. 6 shows the uniform range MMW + M31 ∈ [1.9, 3.3]×1012 M⊙. The mass of the LG has to be at least in that range; higher values could arise because of the unknown dark matter distributed around the galaxies. The masses via the virial theorem and the Hubble flow (which are biased low) are within the total mass estimate. In an earlier study, reference Benisty et al. (2022) used the TA in a Λ-embedding with the simulation calibration and the impact of the LMC and obtained a mass, which falls into the red area, but is biased high. In this research, we changed the embedding from Λ to the full ä/a in a ΛCDM universe and found a stronger compatibility, with these independent probes. For the first time, we see that such a low prediction for the LG mass also emerges from the TA. Further investigations to map the dark matter distribution are required to reconcile all mass estimates to a higher precision and accuracy.
Acknowledgments
DB thanks Jorge Peñarubbia, Jenny Wagner and Noam Libeskind for useful discussions and suggestions. DB thanks for Carl-Wilhelm Fueck Stiftung and the Margarethe und Herbert Puschmann Stiftung. DB has received partial support from the European COST action CA21136.
References
- Benisty, D., Vasiliev, E., Evans, N. W., et al. 2022, ApJ, 928, L5 [NASA ADS] [CrossRef] [Google Scholar]
- Benisty, D., Wagner, J., & Staicova, D. 2024, A&A, 683, A83 [NASA ADS] [CrossRef] [EDP Sciences] [Google Scholar]
- Chamberlain, K., Price-Whelan, A. M., Besla, G., et al. 2023, ApJ, 942, 18 [CrossRef] [Google Scholar]
- Chernin, A. D., Karachentsev, I. D., Valtonen, M. J., et al. 2004, A&A, 415, 19 [NASA ADS] [CrossRef] [EDP Sciences] [Google Scholar]
- Chernin, A. D., Teerikorpi, P., & Baryshev, Y. V. 2006, A&A, 456, 13 [NASA ADS] [CrossRef] [EDP Sciences] [Google Scholar]
- Chernin, A. D., Teerikorpi, P., Valtonen, M. J., et al. 2009, ArXiv e-prints [arXiv:0902.3871] [Google Scholar]
- Chernin, A. D., Emelyanov, N. V., & Karachentsev, I. D. 2015, MNRAS, 449, 2069 [NASA ADS] [CrossRef] [Google Scholar]
- Correa Magnus, L., & Vasiliev, E. 2022, MNRAS, 511, 2610 [NASA ADS] [CrossRef] [Google Scholar]
- Del Popolo, A., & Chan, M. H. 2022, ApJ, 926, 156 [NASA ADS] [CrossRef] [Google Scholar]
- Diaz, J. D., Koposov, S. E., Irwin, M., Belokurov, V., & Evans, N. W. 2014, MNRAS, 443, 1688 [CrossRef] [Google Scholar]
- Faraoni, V., & Jacques, A. 2007, Phys. Rev. D, 76, 063510 [Google Scholar]
- Gonzalez, R. E., Kravtsov, A. V., & Gnedin, N. Y. 2014, ApJ, 793, 91 [CrossRef] [Google Scholar]
- Hartl, O. V., & Strigari, L. E. 2022, MNRAS, 511, 6193 [CrossRef] [Google Scholar]
- Kahn, F. D., & Woltjer, L. 1959, ApJ, 130, 705 [NASA ADS] [CrossRef] [Google Scholar]
- Kaloper, N., Kleban, M., & Martin, D. 2010, Phys. Rev. D, 81, 104044 [NASA ADS] [CrossRef] [Google Scholar]
- Karachentsev, I. D., Kashibadze, O. G., Makarov, D. I., & Tully, R. B. 2009, MNRAS, 393, 1265 [NASA ADS] [CrossRef] [Google Scholar]
- Lemos, P., Jeffrey, N., Whiteway, L., et al. 2021, Phys. Rev. D, 103, 023009 [NASA ADS] [CrossRef] [Google Scholar]
- Li, Y.-S., & White, S. D. M. 2008, MNRAS, 384, 1459 [CrossRef] [Google Scholar]
- Lynden-Bell, D. 1981, The Observatory, 101, 111 [NASA ADS] [Google Scholar]
- McLeod, M., Libeskind, N., Lahav, O., & Hoffman, Y. 2017, JCAP, 2017, 034 [CrossRef] [Google Scholar]
- McVittie, G. C. 1933, MNRAS, 93, 325 [NASA ADS] [CrossRef] [Google Scholar]
- Nandra, R., Lasenby, A. N., & Hobson, M. P. 2012, MNRAS, 422, 2931 [NASA ADS] [CrossRef] [Google Scholar]
- Partridge, C., Lahav, O., & Hoffman, Y. 2013, MNRAS, 436, 45 [Google Scholar]
- Peñarrubia, J., Ma, Y.-Z., Walker, M. G., & McConnachie, A. 2014, MNRAS, 443, 2204 [Google Scholar]
- Peñarrubia, J., Gómez, F. A., Besla, G., Erkal, D., & Ma, Y.-Z. 2016, MNRAS, 456, L54 [CrossRef] [Google Scholar]
- Peebles, P. J. E., & Ratra, B. 2003, Rev. Mod. Phys., 75, 559 [NASA ADS] [CrossRef] [Google Scholar]
- Peirani, S., & de Freitas Pacheco, J. A. 2006, New Astron., 11, 325 [NASA ADS] [CrossRef] [Google Scholar]
- Peirani, S., & Pacheco, J. A. D. F. 2008, A&A, 488, 845 [NASA ADS] [CrossRef] [EDP Sciences] [Google Scholar]
- Planck Collaboration VI. 2020, A&A, 641, A6 [Erratum: A&A, 652, C4 (2021)] [NASA ADS] [CrossRef] [EDP Sciences] [Google Scholar]
- Raychaudhury, S., & Lynden-Bell, D. 1989, MNRAS, 240, 195 [NASA ADS] [CrossRef] [Google Scholar]
- Salomon, J. B., Ibata, R., Reylé, C., et al. 2021, MNRAS, 507, 2592 [NASA ADS] [Google Scholar]
- Sawala, T., Peñarrubia, J., Liao, S., & Johansson, P. H. 2023a, MNRAS, 526, L77 [NASA ADS] [CrossRef] [Google Scholar]
- Sawala, T., Teeriaho, M., & Johansson, P. H. 2023b, MNRAS, 521, 4863 [NASA ADS] [CrossRef] [Google Scholar]
- Sereno, M., & Jetzer, P. 2007, Phys. Rev. D, 75, 064031 [NASA ADS] [CrossRef] [Google Scholar]
- Teerikorpi, P., & Chernin, A. D. 2010, A&A, 516, A93 [NASA ADS] [CrossRef] [EDP Sciences] [Google Scholar]
- van der Marel, R. P., Fardal, M., Besla, G., et al. 2012, ApJ, 753, 8 [NASA ADS] [CrossRef] [Google Scholar]
- van der Marel, R. P., Fardal, M. A., Sohn, S. T., et al. 2019, ApJ, 872, 24 [NASA ADS] [CrossRef] [Google Scholar]
- Wang, W., Han, J., Cautun, M., Li, Z., & Ishigaki, M. N. 2020, Sci. China Phys. Mech. Astron., 63, 109801 [NASA ADS] [CrossRef] [Google Scholar]
All Figures
|
Fig. 1. Ratio between ä/a and Λc2/3 vs. time assuming the ΛCDM model. Asymptotically, both models approach the same value. For the ä/a case, the expansion rate of the Universe creates an attractive force at early times and only becomes repulsive at late times. |
| In the text | |
|
Fig. 2. Separation at the Big Bang between MW and M 31 for different forces. The minima identify the TA masses, since they satisfy the condition of r[t = 0] = 0. The TA mass for the Λ embedding is higher mass then the Newtonian TA, and the ä/a embedded mass is the lowest one. |
| In the text | |
|
Fig. 3. Dependence between the predicted TA mass vs the age of the Universe (left) and vs the value of the Hubble parameter H0 (right), with the mean values of the separation and the radial velocity. For larger Universe ages, the predicted TA mass is lower and for larger H0 the TA mass is higher. The TA + Λ mass is always the highest and the TA + ä/a mass is the lowest one for any H0. |
| In the text | |
|
Fig. 4. Correlation between the TA mass and the simulation based mass. These ∼600 pairs are selected from the IllustrisTNG cosmological simulation, in which the mass correction factor is computed as the ratio of the virilized halo mass of both galaxies to the mass obtained by the Newtonian TA. The mass ratio is expressed as: Mvir/MTA = 0.82 ± 0.20. |
| In the text | |
|
Fig. 5. Posterior distribution of values of M 31’s radial and tangential velocity for the Monte Carlo samples generated from the prior on the magnitude of vtan from van der Marel et al. (2019) (purple). After compensating for the LMC perturbation, (Benisty et al. 2022) generates the corresponding vrad and vtan that used here as the modified effect of the LMC (green). The vrad is increased by [25, 30 km/s] and vrad is shifted to −75 ± 15 km/s. |
| In the text | |
|
Fig. 6. Predicted total mass of the LG of galaxies based on the proper motion of M 31 towards us (TA) with the simulation calibrations. The figure compares masses inferred from different embedding with ä/a vs. pure Λ, and from different methods in the literature: the virial theorem (Diaz et al. 2014), Hubble flow (Peñarrubia et al. 2014), TA + Λ + LMC (Benisty et al. 2022), artificial neural networks on simulated pairs (McLeod et al. 2017), and Gaussian processes on simulated pairs (Sawala et al. 2023b). The red area shows the uniform range MMW + M31 ∈ [1.9, 3.3]×1012 M⊙ which is based on complementary total mass estimate of the MW and M 31 galaxies (Wang et al. 2020; Sawala et al. 2023b). The total LG virialized mass should be higher then the total halo masses. |
| In the text | |
Current usage metrics show cumulative count of Article Views (full-text article views including HTML views, PDF and ePub downloads, according to the available data) and Abstracts Views on Vision4Press platform.
Data correspond to usage on the plateform after 2015. The current usage metrics is available 48-96 hours after online publication and is updated daily on week days.
Initial download of the metrics may take a while.