Open Access
Fig. 2.
Download original image
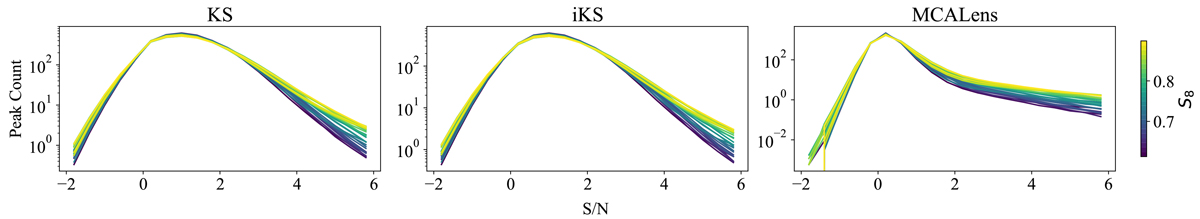
Log-scaled histograms of the peak counts as a function of the signal-to-noise ratio. The three panels (from left to right) correspond to the KS, iKS, and MCALens methods, for the 25 simulated cosmologies. The histograms are colour-coded by their S8 value.
Current usage metrics show cumulative count of Article Views (full-text article views including HTML views, PDF and ePub downloads, according to the available data) and Abstracts Views on Vision4Press platform.
Data correspond to usage on the plateform after 2015. The current usage metrics is available 48-96 hours after online publication and is updated daily on week days.
Initial download of the metrics may take a while.