Fig. 8
Download original image
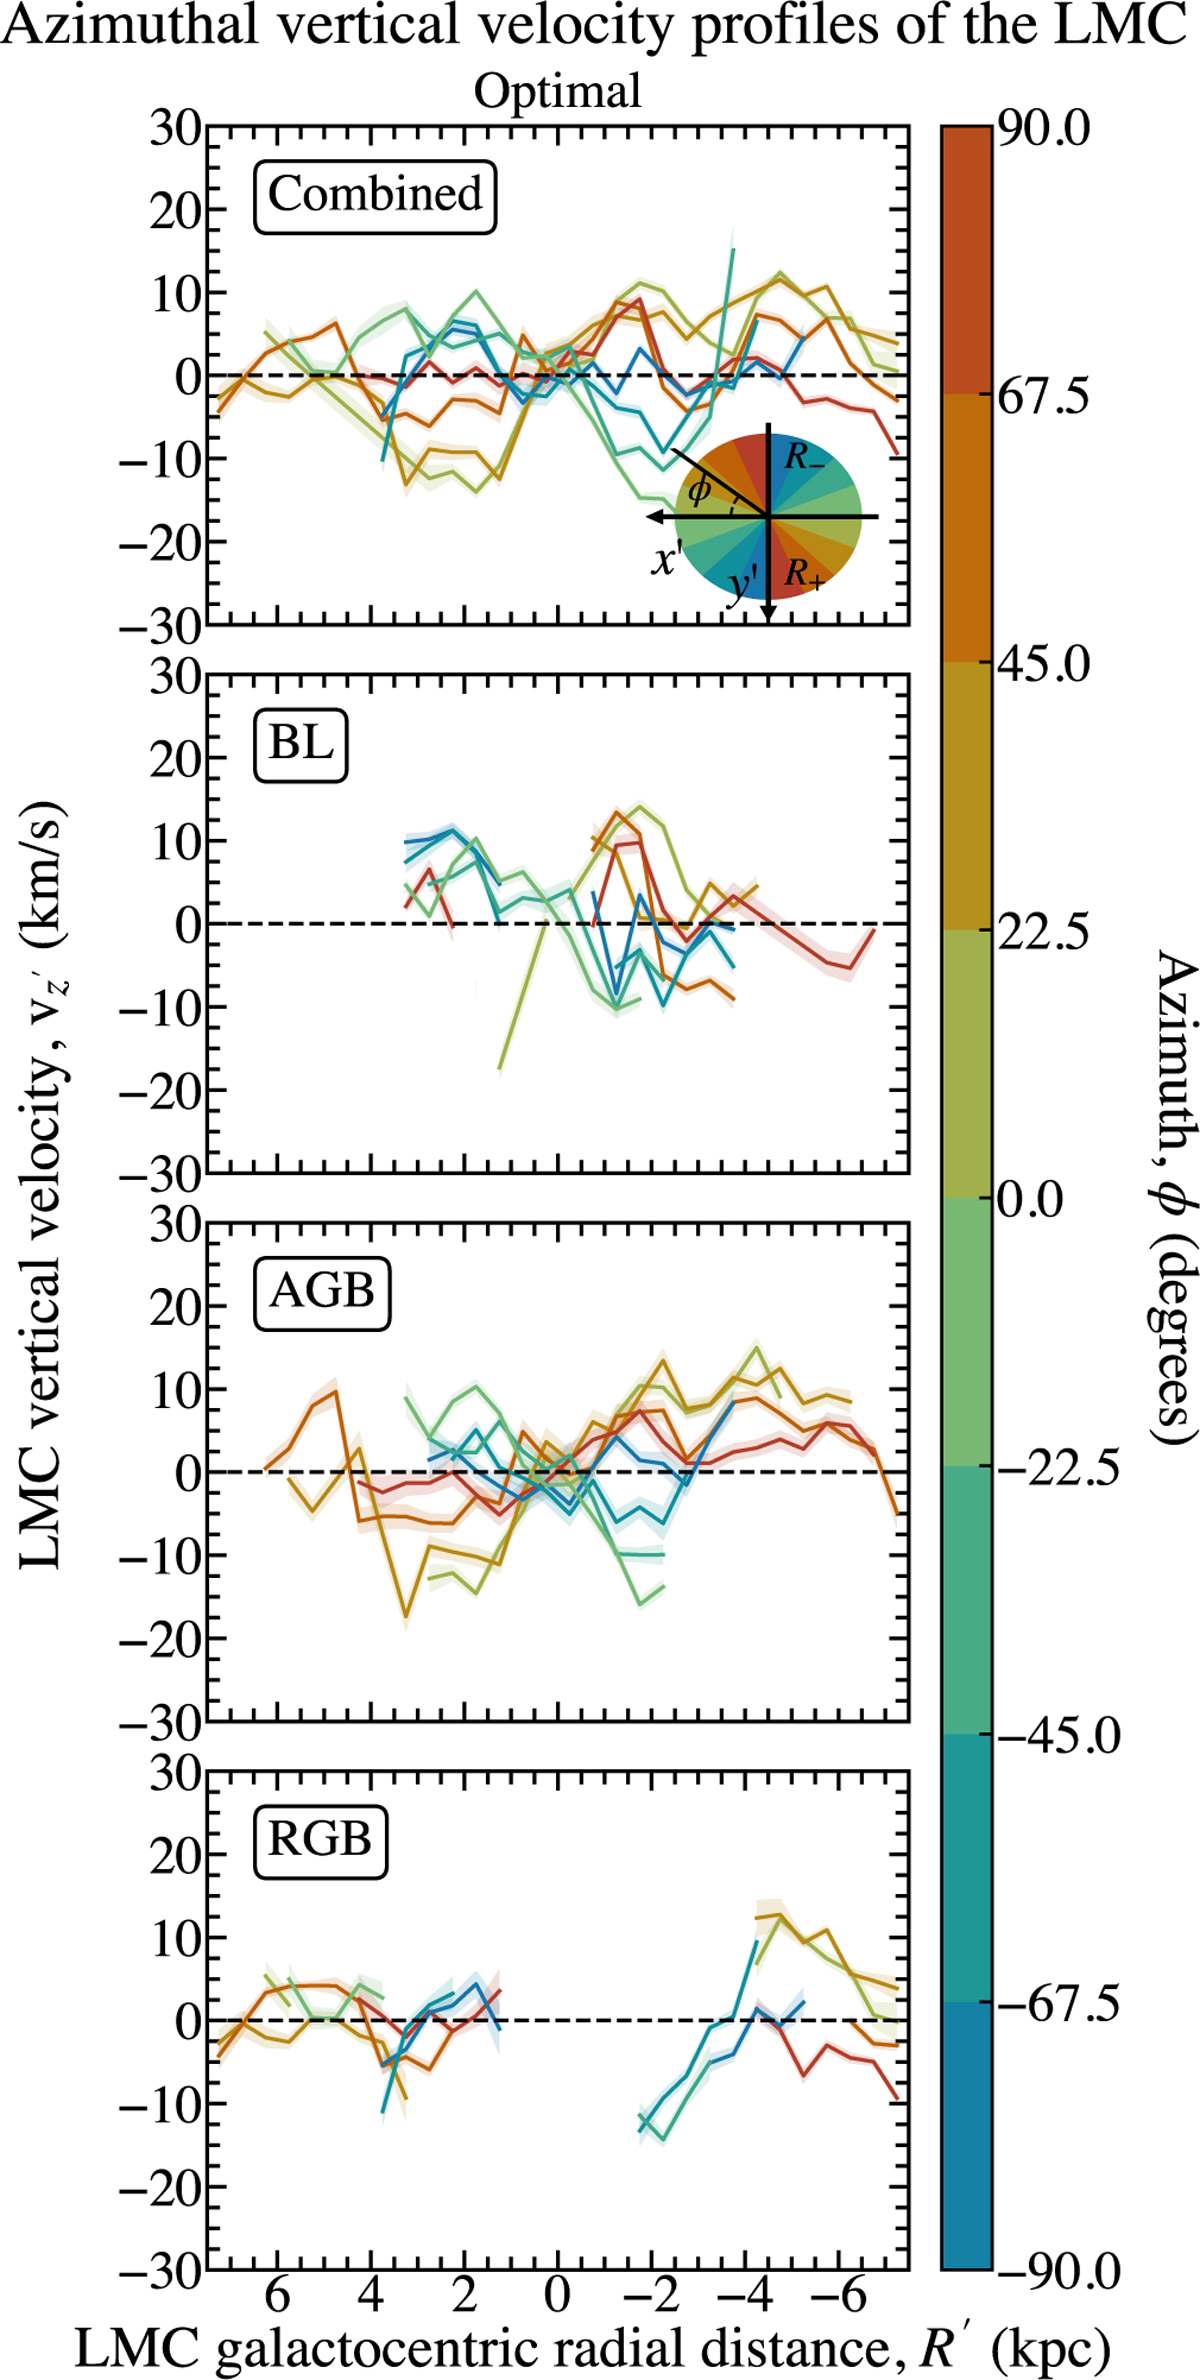
Comparison of the azimuthal vertical velocity profiles between the LMC optimal Combined sample and its different evolutionary phases. From top to bottom, Combined, BL, AGB, and RGB samples. Because of its low statistical representation, the Young sample is not displayed. Only radial bins with more than 25 sources are plotted. Each colour corresponds to a different azimuth ϕ defined in the LMC in-plane (x′, y′) Cartesian coordinate system – see schema in the top right panel. The vertical velocity uncertainty of each bin, determined by the MAD/ ![]() , is displayed in the transparent shadows of each curve. These uncertainties are generally small, and the shadows are therefore difficult to tell apart from the curves themselves.
, is displayed in the transparent shadows of each curve. These uncertainties are generally small, and the shadows are therefore difficult to tell apart from the curves themselves.
Current usage metrics show cumulative count of Article Views (full-text article views including HTML views, PDF and ePub downloads, according to the available data) and Abstracts Views on Vision4Press platform.
Data correspond to usage on the plateform after 2015. The current usage metrics is available 48-96 hours after online publication and is updated daily on week days.
Initial download of the metrics may take a while.