Fig. 3
Download original image
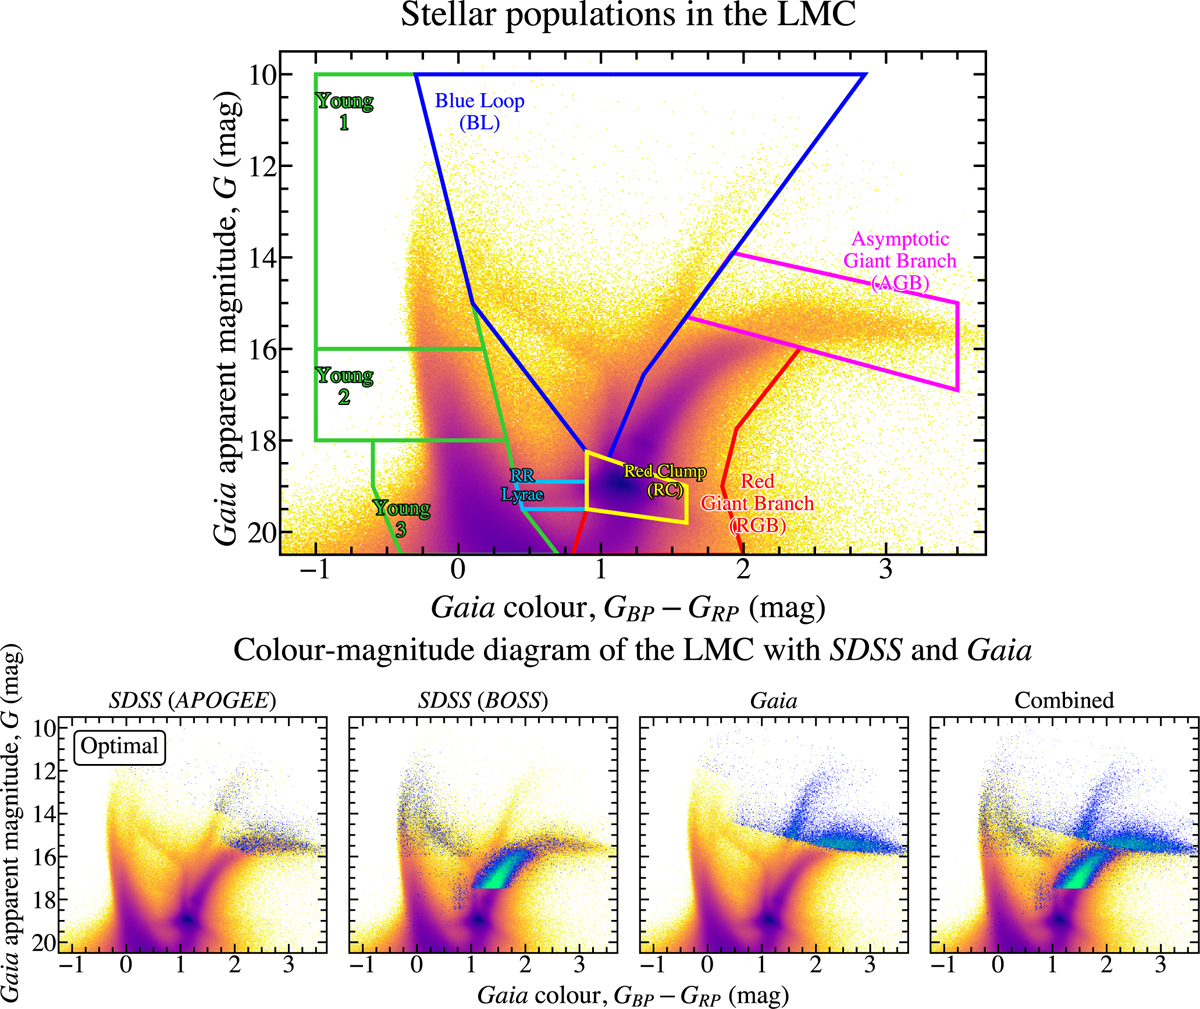
Top panel: colour-magnitude diagram of the LMC optimal sample (9 810 031 stars) with the areas of the different evolutionary phases (as defined by the polygons given in Gaia Collaboration 2021b). Second row: Comparison of the CMD between the different surveys for the LMC optimal sample. From left to right: APOGEE, BOSS, Gaia, and Combined sample. In each sample, the foreground image represents the relative density of stars with line-of-sight velocity. Higher densities are highlighted by lighter (greener) colours, while lower densities are shown by darker (bluer) colours. The background of the bottom panel displays the CMD for the optimal LMC sample, which consists of 9 810 031 stars. The colours represent the relative stellar density, with darker colours indicating higher densities.
Current usage metrics show cumulative count of Article Views (full-text article views including HTML views, PDF and ePub downloads, according to the available data) and Abstracts Views on Vision4Press platform.
Data correspond to usage on the plateform after 2015. The current usage metrics is available 48-96 hours after online publication and is updated daily on week days.
Initial download of the metrics may take a while.