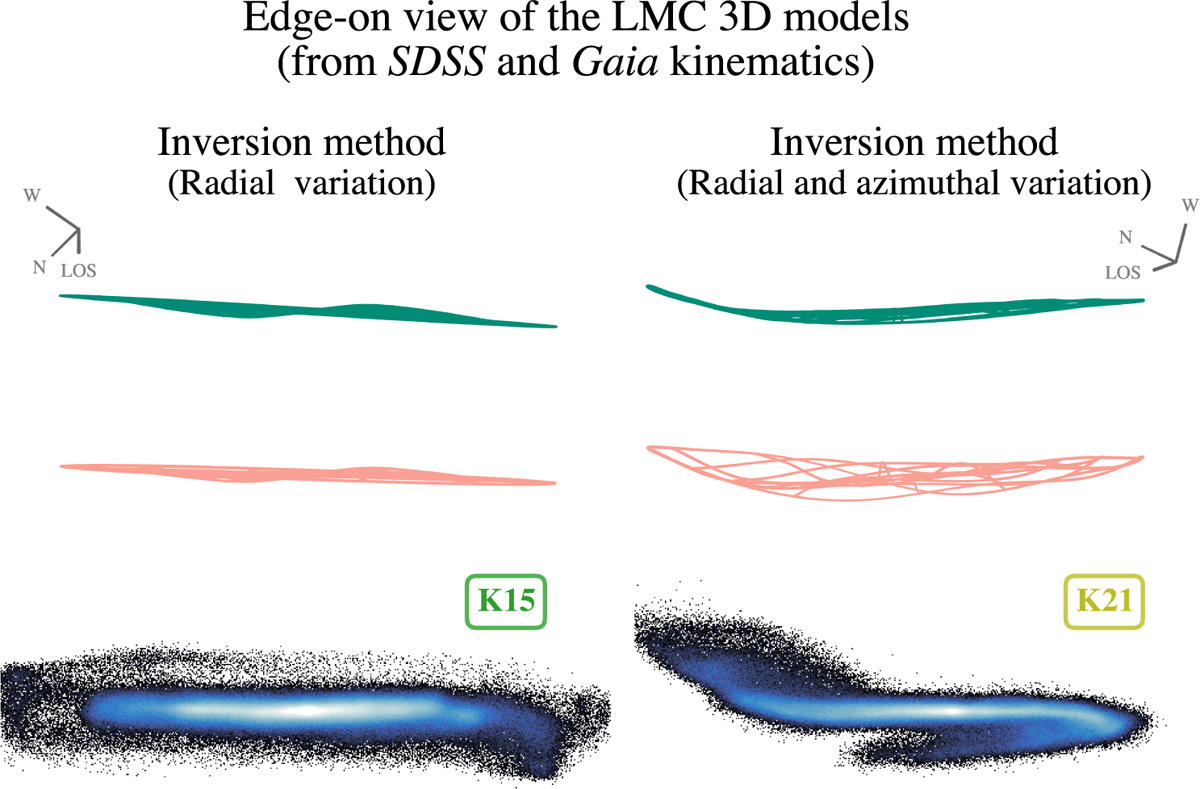
Fig. 14
Download original image
Edge-on view of LMC 3D models. First and second row left panels: inversion method to best fit the inferred viewing angle variations with the galactocentric radius R′ as a continuous surface. First and second right panels: inversion method to best fit the inferred viewing angle variations with both the galactocentric radius R′ and azimuth ϕ as a continuous surface. We plot a triad that displays the unit vectors in the following directions: W, N, and LOS, being the last the observer’s direction. In the (x, y, z) frame, those vectors are defined by (1, 0, 0), (0, 1, 0), and (0, 0, 1), respectively – see Fig. 11 of Jiménez-Arranz et al. (2023b). To best highlight the tilted bar (left) and outer warp (right), the two 3D models are viewed from different angles, with a difference of Δ ϕ = 70∘ in the edge-on plane. Top panels (green): LMC Combined complete sample. Central panels (salmon): LMC Combined optimal sample. Bottom panels: For comparison, two N-body simulated LMC analogues from the KRATOS suite (Jiménez-Arranz et al. 2024b), K15 (left) and K21 (right), respectively. These were selected visually for resembling the edge-on views above determined from the data.
Current usage metrics show cumulative count of Article Views (full-text article views including HTML views, PDF and ePub downloads, according to the available data) and Abstracts Views on Vision4Press platform.
Data correspond to usage on the plateform after 2015. The current usage metrics is available 48-96 hours after online publication and is updated daily on week days.
Initial download of the metrics may take a while.