Fig. 5
Download original image
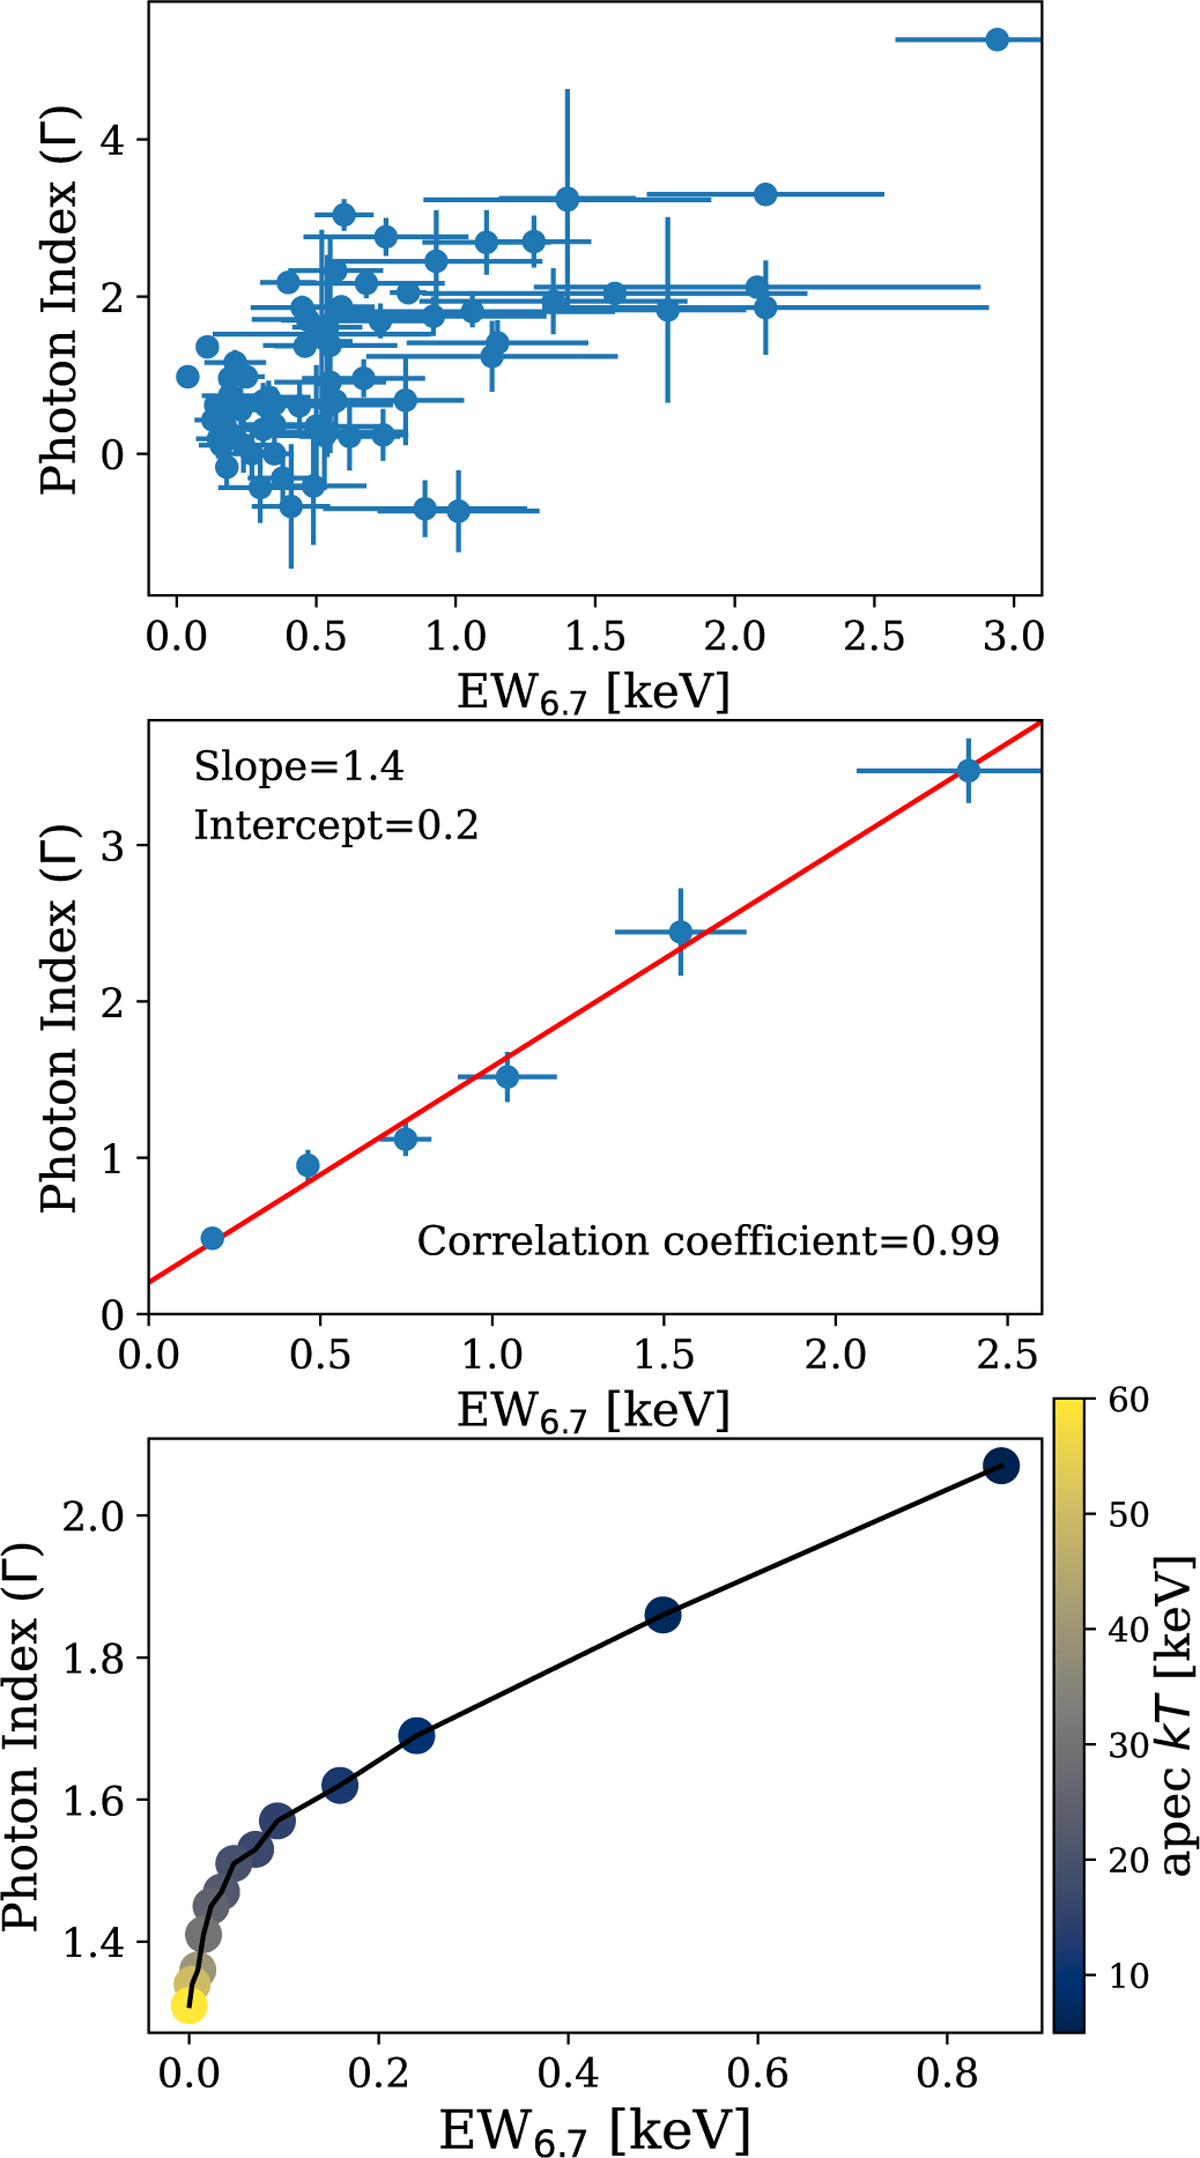
Top panel: scatter plot of photon index Γ vs. EW6.7 of the 72 sources listed in Table A.1. Middle panel: same as the above plot, with data re-binned with an EW step size of 0.3 keV and errors propagated from individual measurement. Bottom panel: linear correlation between Γ vs. EW6.7 obtained from spectral simulation of ionised plasma at different temperatures of solar abundance.
Current usage metrics show cumulative count of Article Views (full-text article views including HTML views, PDF and ePub downloads, according to the available data) and Abstracts Views on Vision4Press platform.
Data correspond to usage on the plateform after 2015. The current usage metrics is available 48-96 hours after online publication and is updated daily on week days.
Initial download of the metrics may take a while.