Fig. 3
Download original image
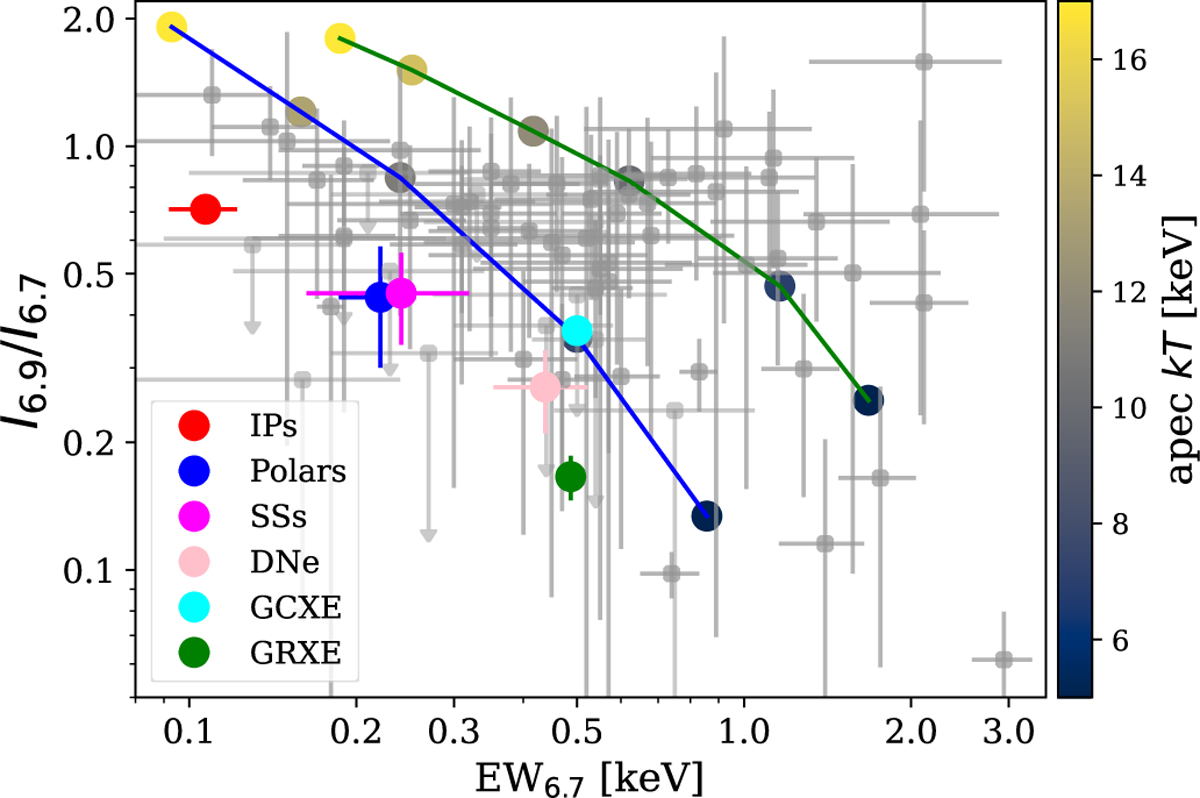
Line intensity ratio ![]() vs. EW6.7 plot for sources emitting a 6.7 keV line. Error bars indicate 1σ uncertainty. Mean values of
vs. EW6.7 plot for sources emitting a 6.7 keV line. Error bars indicate 1σ uncertainty. Mean values of ![]() and EW6.7 for different CV-types from Xu et al. (2016) are shown for comparison. The EW6.7 and
and EW6.7 for different CV-types from Xu et al. (2016) are shown for comparison. The EW6.7 and ![]() values of the GCXE and GRXE are taken from Nobukawa et al. (2016). The dots with blue (abundance Zʘ) and green (abundance 2Zʘ) lines shows the values of EW6.7 and
values of the GCXE and GRXE are taken from Nobukawa et al. (2016). The dots with blue (abundance Zʘ) and green (abundance 2Zʘ) lines shows the values of EW6.7 and ![]() expected from collisionally ionised plasma at different temperatures.
expected from collisionally ionised plasma at different temperatures.
Current usage metrics show cumulative count of Article Views (full-text article views including HTML views, PDF and ePub downloads, according to the available data) and Abstracts Views on Vision4Press platform.
Data correspond to usage on the plateform after 2015. The current usage metrics is available 48-96 hours after online publication and is updated daily on week days.
Initial download of the metrics may take a while.