Open Access
Fig. 14
Download original image
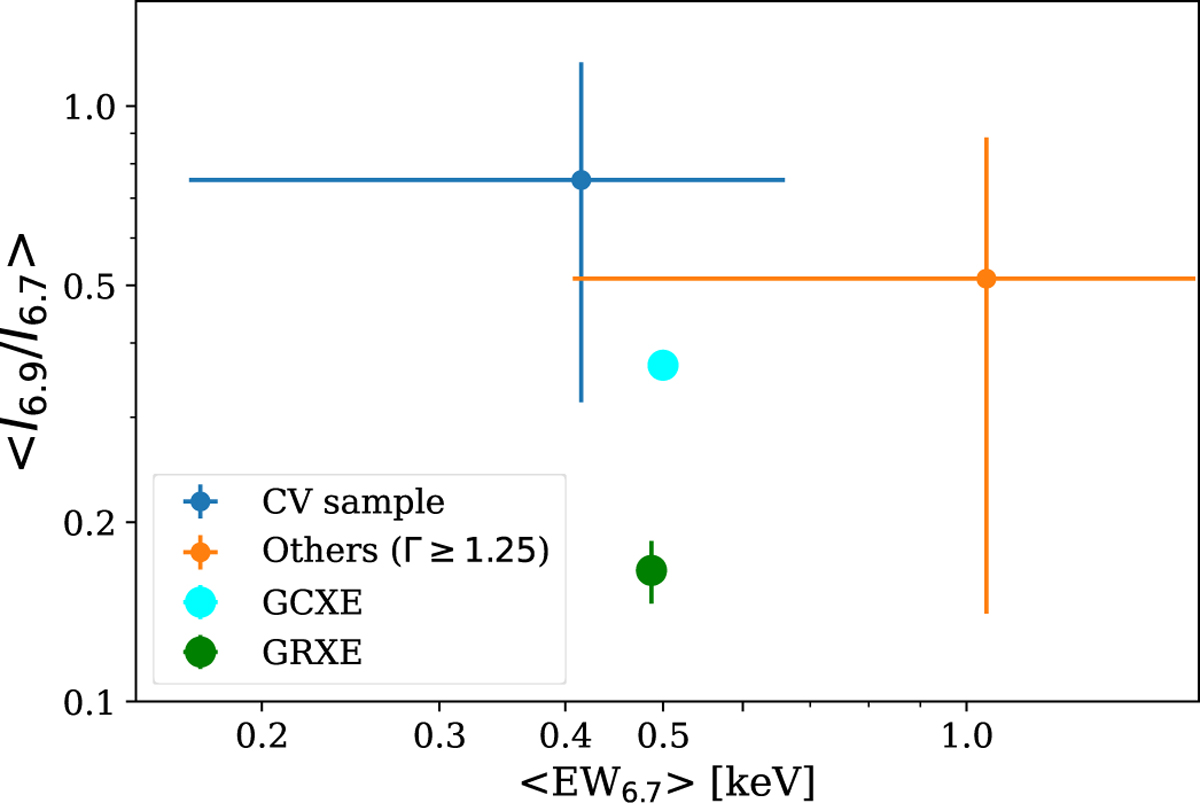
Comparison of the mean EW6.7 and ![]() for our hard CV and soft source samples with those of the GCXE and GRXE. The measurement uncertainties represent the 1σ standard deviation. The GCXE and GRXE values are taken from Nobukawa et al. (2016).
for our hard CV and soft source samples with those of the GCXE and GRXE. The measurement uncertainties represent the 1σ standard deviation. The GCXE and GRXE values are taken from Nobukawa et al. (2016).
Current usage metrics show cumulative count of Article Views (full-text article views including HTML views, PDF and ePub downloads, according to the available data) and Abstracts Views on Vision4Press platform.
Data correspond to usage on the plateform after 2015. The current usage metrics is available 48-96 hours after online publication and is updated daily on week days.
Initial download of the metrics may take a while.