Fig. 1
Download original image
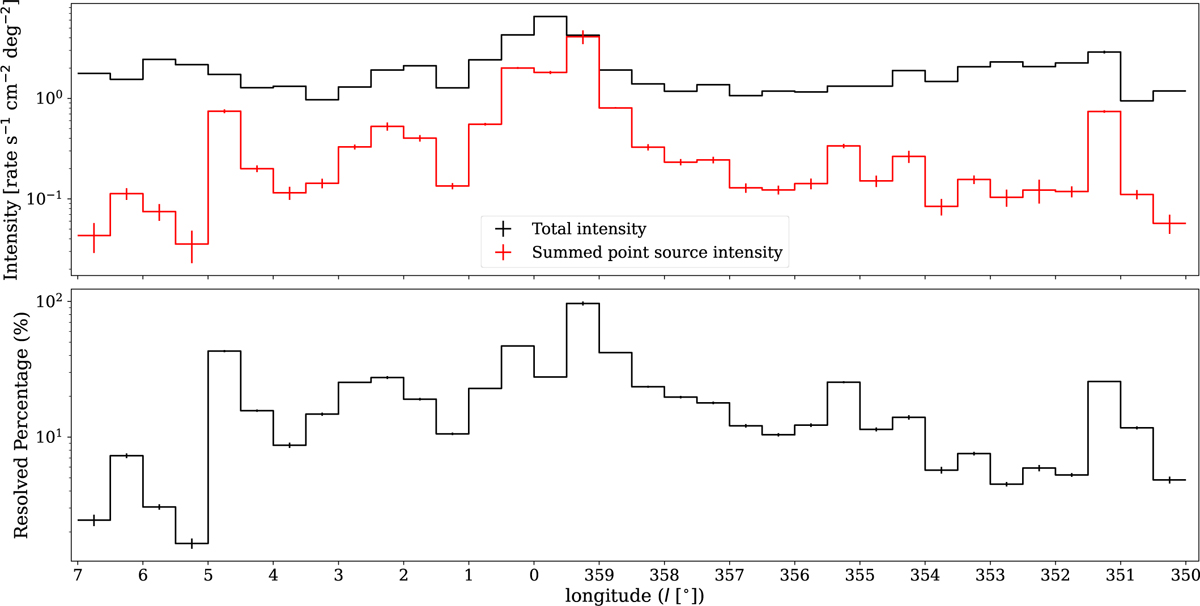
Top panel: longitude profile of total emission (point sources plus unresolved emission) in the 6.5–7.0 keV range, integrated over -0.8° ≤ b ≤ 0.8° (black curve). The red curve shows the contribution from point sources detected with ML > 14 in the 1–12 keV band. Bottom panel: percentage of the total 6.5–7.0 keV emission resolved by X-ray point sources.
Current usage metrics show cumulative count of Article Views (full-text article views including HTML views, PDF and ePub downloads, according to the available data) and Abstracts Views on Vision4Press platform.
Data correspond to usage on the plateform after 2015. The current usage metrics is available 48-96 hours after online publication and is updated daily on week days.
Initial download of the metrics may take a while.