| Issue |
A&A
Volume 698, May 2025
|
|
|---|---|---|
| Article Number | A257 | |
| Number of page(s) | 10 | |
| Section | Stellar structure and evolution | |
| DOI | https://doi.org/10.1051/0004-6361/202453585 | |
| Published online | 17 June 2025 | |
Circumbinary disc interactions and stochastic dust obscuration in the post-asymptotic-giant-branch binary HD 213985
1
Nicolaus Copernicus Astronomical Center, Polish Academy of Sciences, Bartycka 18, 00-716 Warsaw, Poland
2
Astronomical Observatory, University of Warsaw, Al. Ujazdowskie 4, 00-478 Warszawa, Poland
3
Institut d’Astronomie et d’Astrophysique, Université Libre de Bruxelles, CP 226, Boulevard du Triomphe, 1050 Brussels, Belgium
4
Nicolaus Copernicus Astronomical Center, Polish Academy of Sciences, Rabiańska 8, 87-100 Toruń, Poland
5
Institute of Astronomy, KU Leuven, Celestijnenlaan 200D, 3001 Leuven, Belgium
⋆ Corresponding author: ilkiewicz@camk.edu.pl
Received:
22
December
2024
Accepted:
17
April
2025
HD 213985 is an eccentric binary system with a post-AGB primary and a jet-launching secondary star. We confirm that the system photometric variability is likely due to obscuration by the inner edge of a circumbinary disc, similar to RVb-type RV Tau stars. The system has shown an increase in the orbital variability amplitude in optical photometric bands, along with irregular changes in its shape that often started to appear skewed. Variability in the Na D lines suggests that this behaviour may be driven by interactions between the circumbinary disc and outflows through the L2 Lagrange point. Moreover, HD 213985 has exhibited episodes of short-term fluctuations whose appearance is not strictly related to the orbital phase. This variability is consistent with obscuration by transient dust structure leading to weather-like variability patterns.
Key words: protoplanetary disks / stars: AGB and post-AGB / circumstellar matter / stars: individual: HD 213985
© The Authors 2025
 Open Access article, published by EDP Sciences, under the terms of the Creative Commons Attribution License (https://creativecommons.org/licenses/by/4.0), which permits unrestricted use, distribution, and reproduction in any medium, provided the original work is properly cited.
This article is published in open access under the Subscribe to Open model. Subscribe to A&A to support open access publication.
1. Introduction
Post-asymptotic giant branch (post-AGB) objects are low-mass stars in a fast transition phase between the AGB and planetary nebula stages of evolution (e.g. Miller Bertolami 2016). Post-AGB objects in binaries are of particular interest, as they are important for our understanding of the influence of binarity on stellar evolution (Van Winckel 2016, 2018). Binary post-AGB stars often have eccentric orbits and orbital periods on the order of years (Oomen et al. 2018). The system configuration typically consists of a post-AGB primary interacting with a jet-launching main sequence companion surrounded by an accretion disc (hereafter referred to as circumcompanion disc). Moreover, the binaries are surrounded by circumbinary discs ejected by the primary at the end of the AGB stage of evolution (e.g. Corporaal et al. 2023). Roughly 85 post-AGB binaries have been discovered thus far (Kluska et al. 2022).
HD 213985 (=HM Aqr) is a binary system with a post-AGB primary (Waelkens et al. 1987, 1995; van Winckel et al. 2000; Jorissen et al. 2009). The post-AGB star spectroscopic classification is A0III (Houk & Smith-Moore 1988). The infrared spectral energy distribution indicates the presence of a full circumbinary disc, according to the classification of Kluska et al. (2022). The binary period is 259.6 ± 0.7 days, and the orbit eccentricity is 0.21 ± 0.05 (Oomen et al. 2018). The orbit inclination is  (Bollen et al. 2022), and the circumbinary disc is in, or close to, the orbital plane (i ≃ 60°; Kluska et al. 2019). The accretor in HD 213985 is launching a wide jet, typical for such binaries (Bollen et al. 2022). The jet is tilted by
  from the binary orbit (Bollen et al. 2022).
Since the mid-1980s to early-1990s HD 213985 has shown sinusoidal orbital variability with an amplitude of ∼0.1 mag in optical and near-infrared filters (Waelkens et al. 1987; Whitelock et al. 1989; Şahin & Jeffery 2007). Small changes of the light curve shape between orbital cycles have been noted by Kiss et al. (2007) in the V band, that the authors have attributed to on-going changes in the circumstellar shell. This is similar to RVb phenomenon in RV Tau type variables, where the amplitude of pulsating post-AGB star changes due to periodic obscuration by the circumbinary dusty disc (Kiss & Bódi 2017).
Here we investigate the evolution of variability of HD 213985. For this purpose, we employed ground-based and space-based photometric observations, as well as high-resolution spectroscopy introduced in Section 2. In Section 3, we present the results of our analysis of HD 213985 orbital and short-term variability. The proposed mechanism for the HD 213985 behaviour is described in Section 4. Our conclusions are presented in Section 5.
2. Data
2.1. Photometric observations
We compiled ground-based photometric observations in V band from the All Sky Automated Survey (ASAS; Pojmanski 1997; Pojmanski & Maciejewski 2005), as well as in g and V filters from the All-Sky Automated Survey for Supernovae (ASAS-SN; Shappee et al. 2014; Kochanek et al. 2017). The ASAS data was partially analysed by Kiss et al. (2007), where the authors have found small changes in the orbital variability. The quality of ASAS-SN g-band observations decreases after MJD = 59300 and a large instrumental scatter starts to appear, likely due to the star being close to the limiting magnitude of the telescopes. Since the instrumental scatter seems to increase with time, we have limited our analysis to data before MJD = 59600. The studied light curve spans from 19 August 2001 to 20 January 2020. The full light curve is presented in Fig. 1 and the phase plots are presented in Fig. A.1.
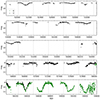 |
Fig. 1. Ground-based light curve of HD 213985. Black and green points represent observations in the V and g filters, respectively. The grey lines indicate an orbital phase of zero, corresponding to the times of periastron passage (Oomen et al. 2018). The data quality declines after MJD = 59300, with increased instrumental scatter. |
We include in our analysis space-based observations from the K2 mission (Howell et al. 2014) covering 15 November 2014 to 23 January 2015, and the Transiting Exoplanet Survey Satellite (TESS; Ricker et al. 2015) data from sectors 2, 42, and 69 (September 2018, 2021, and 2023, respectively)1. The TESS light curves have been extracted using the Lightkurve package (Lightkurve Collaboration 2018). The K2 light curve is taken directly from the mission data products. In the case of TESS data, we have extracted the photometry from the full-frame image cut-outs (Brasseur et al. 2019). We have employed simple aperture photometry (SAP) flux estimates using data from both satellites. The K2 and TESS light curves are presented in Fig. 2.
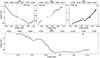 |
Fig. 2. Observations from K2 and TESS sectors 2, 42, and 69. The data were plotted against the HD 213985 orbital ephemeris of Oomen et al. (2018), where phase zero corresponds to the periastron passage and the dotted lines mark the phase of inferior conjunction (post-AGB star is closest to the observer). The fluxes were normalized to the mean flux in each dataset. The decrease in brightness at the orbital phase of 0.49 and a larger scatter of data at the time of inferior conjunction in TESS sector 69 data are likely instrumental artefacts. |
We also analyze infrared light curves from the Wide-field Infrared Survey Explorer (WISE; Wright et al. 2010; Mainzer et al. 2011) observations spanning from 24 May 2010 to 5 November 2023. The WISE observations in W1 and W2 filters have been retrieved using methods described by Hwang & Zakamska (2020)2. The data is binned with a 3 day bin size. In each bin, a weighted average and its error are calculated using individual measurement errors.
2.2. Spectroscopic observations
We make use of observations with the HERMES echelle spectograph (R ∼ 85 000; Raskin et al. 2011) mounted on a 1.2m Mercator telescope at Roque de los Muchachos observatory. HD 213985 has been monitored from 5 August 2009 to 3 January 2024 as part of a post-AGB binaries monitoring programme (Van Winckel et al. 2010). The have already been partially employed for modelling the jets in HD 213985 (Bollen et al. 2022) and for determining the spectroscopic orbit (Oomen et al. 2018).
3. Results
At the beginning of the observed time period, the orbital variability of HD 213985 was symmetrical with the minimum located roughly at the orbital phase ∼0.5, but with a marginally variable amplitude (Fig. A.1). A deviation from symmetry has started to appear at MJD ≃ 57300, where the decrease in brightness was larger at phases shortly after the periastron passage (phase 0). However, the amplitude of the orbital variability remained relatively low (ΔV ≲ 0.5 mag). This behaviour has already been noted by Kiss et al. (2007).
Since its appearance, the asymmetry in the orbital variability has been present throughout the remaining observing period. The amplitude of variability has started increasing significantly from MJD ≃ 57850 and has remained at ΔV ≃ 2 mag since MJD ≃ 58300 (Fig. 1). Moreover, the shape of the variability has become more irregular and since MJD ≃ 58600 a quasi-plateau at the minimum has been present. Despite the emergence of the somewhat irregular variability, if the orbital variability was asymmetrical, the system is always fainter shortly after the periastron passage (Fig. A.1). The change in the shape of the orbital variability has been associated with a change in the maximum brightness of HD 213985. Namely, maximum brightness during an orbital cycle has appeared to decrease from V = 8.8 mag at MJD ≃ 52050 to V = 9.1 mag at MJD ≃ 58300.
The space-based photometry reveals that HD 213985 experienced episodic small-amplitude short-term fluctuations on timescales of days (Fig. 2). This variability was present all throughout the K2 observing period. On the other hand, during TESS sector 2 the star has initially shown a smooth and relatively fast decrease in brightness until orbital phase ∼0.42, when the fading has slowed down almost momentarily, but remained smooth afterwards. This continued until orbital phase ∼0.47, when the star has faded by 10% in only 1.05 days. This sudden decrease in brightness was accompanied by the appearance of short-term fluctuations previously seen in K2. After six days, at the orbital phase ∼0.50, the brightness of HD 213985 has increased to a level slightly larger than the one observed just before the sudden fading. Moreover, the short-term fluctuations seem to cease, although the star was not observed for long enough time to assert that with certainty.
During TESS sector 42 observations, HD 213985 brightness has been increasing. Interestingly, short-term fluctuations have appeared throughout the sector, occurring on one of the longer timescales. It is worth noting that the TESS sector 42 dataset is the only time the short-term fluctuations were observed in the second half of the orbital cycle. Moreover, the longer-timescale fluctuations in K2 data have appeared to occur closer to the periastron passage. Hence, there is a possibility of a correlation between the timescale of the short-term fluctuations and the orbital phase. However, there is not enough data to claim that with any confidence.
In the overlapping phases of the TESS observations from sectors 2 and 69, the system has behaved radically differently. In particular, during TESS sector 69 observations, HD 213985 has shown a smooth increase in brightness with no signs of short-term fluctuations, while the opposite is true for sector 2. Notably, it appears that no changes in the smooth increase in brightness have been present at the orbital phase ∼0.47 at which a sudden fading has been observed during sector 2. We note that in TESS sector 69 data there is a large scatter and a fading at orbital phase ∼0.49, but it is likely due to instrumental artefacts.
3.1. Infrared light curve
The brightness of HD 213985 has increased in W1 and W2 filters by ∼1 mag between MJD ∼ 55000 and ∼57000 (Fig. 3). Interestingly, the increase in infrared brightness has occurred roughly at the same time as the appearance of asymmetry in the orbital variability observed in the optical range, and decrease in the maximum brightness in the V filter. After the increase in the infrared brightness, the object has shown variability with amplitude of ∼0.5 mag, although the variability in the W1 and W2 filters appears only partially correlated.
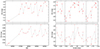 |
Fig. 3. WISE photometric measurements (red points). Left panels: Full light curve. Right panels: Phase plot of WISE observations made after MJD 56000 using the orbital ephemeris of Oomen et al. (2018), where the dotted lines mark the phase of inferior conjunction (post-AGB star closest to the observer). |
The low cadence of the infrared photometry makes it impossible to study cycle-to-cycle variations of the orbital variability, and whether it is similar to what is observed in the optical range. However, after combining all the WISE observations after MJD 56000 the overall shape of the phased light curves has become visible (Fig. 3). In particular, the orbital variability in W1 filter is readily present, while it is not present or at least less pronounced in the W2 band. While both these filters are dominated by the light of the circumbinary disc (Kluska et al. 2022), the W1 band captures a larger fraction of the post-AGB starlight compared to W2. Hence, this is consistent with the orbital variability being due to the obscuration of the post-AGB star.
3.2. Na D lines
We have extracted Na I D lines from the HD 213985 spectra and have tracked their variability with the orbital cycle. As expected, the Na D1 (λ5895) and D2 (λ5889) lines behaviour is identical (Fig. 4). Since D1 component has twice lower oscillator strength than D2, this similarity implies optically thin absorption. Their profiles consist mainly of a few interstellar components at radial velocities between −20 and 6 km s−1, a weak absorption line originating from the post-AGB star and following its radial velocity that is mainly visible at −100 km s−1 around orbital phase ∼0.2 and at +30 km s−1 half an orbit later, as well as a strong circumbinary component roughly at the systemic velocity of the binary. The circumbinary component has been observed at the radial velocity of approximately −55 km s−1. The circumbinary component is blueshifted by ∼10 km s−1 relative to the systemic velocity, similarly to what is observed in a post-AGB binary BD+46°442 (Gorlova et al. 2012). Moreover, between the orbital phases ∼0.5 and 0.7, an additional broad absorption profile has become visible.
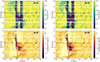 |
Fig. 4. Dynamical spectra of Na D lines. Top panels show the two Na D lines. Bottom panels show the same spectra after subtracting the average spectrum at orbital phases ±0.08 of the periastron passage. The red line represents the post-AGB component radial velocity curve according to the spectroscopic orbit of Oomen et al. (2018). The systemic radial velocity is marked with a dashed blue line, and the time of inferior conjunction is marked with a dashed black line. Orbital phase 0.0 corresponds to the periastron passage. The green line marks a time of enhanced absorption from the circumbinary disc component (hereafter region A). |
To better visualise the variability of Na D lines, we have subtracted the average spectrum taken at orbital phases ±0.08 of the periastron passage, that is, when the absorption of various Na D components was the weakest. As a result, the interstellar components have been removed, and the variability of the circumbinary component has become clearly visible (Fig. 4 bottom). In particular, the strength of the circumbinary component has been strongest around the phases of inferior conjunction, when the post-AGB star is closest to the observer (region A in Fig. 4). The transient absorption profile present between orbital phases ∼0.5 and 0.7 appears at the radial velocity of the post-AGB star or slightly blueshifted. Interestingly, there are no strong absorption components from the jet, seen previously in the Hα profile at times near the superior conjunction, at orbital phases ∼0.97 (Bollen et al. 2022).
4. Discussion
The optical and infrared photometric orbital variability of HD 213985 is consistent with variable obscuration by the inner edge of the circumbinary disc, similarly to what is seen in RVb-type RV Tau stars (Kiss & Bódi 2017; Manick et al. 2019). This interpretation is supported by the variability of the circumbinary component of the Na D lines, observed at a radial velocity of approximately −55 km s−1 (Fig. 4). The Na D absorption is strongest near the time of inferior conjunction, when the post-AGB star is closest to the observer (region A in Fig. 4). As the equivalent width of Na D absorption correlates with dust absorption along the line of sight (Munari & Zwitter 1997; Poznanski et al. 2012), this confirms that the post-AGB star is obscured by the inner edge of the circumbinary disc during inferior conjunction.
The interpretation of the cycle-to-cycle variability is more complicated. Kiss et al. (2007) interpreted these changes as a sign of circumbinary shell/disc variations on timescales similar to the orbital period. This would be consistent with the appearance of the irregular behaviour of the orbital variability roughly at the time when the infrared brightness increased and maximum optical brightness decreased. Moreover, this would be consistent with a large variability of HD 213985 in the W2 filter. It is not obviously connected to the orbital variability, but it rather might reflect changes in the circumbinary disc (Fig. 3). A similar interpretation has been proposed for secular changes in the obscuration degree observed in a RV Tau star U Mon (Vega et al. 2021), where the authors proposed precession of the binary or circumbinary disc inhomogeneity caused by binary-disc interaction (see also Kluska et al. 2018; Oomen et al. 2020). However, the secular changes in U Mon have appeared to be periodic or quasi-periodic (Vega et al. 2021), while the changes in the shape of HD 213985 orbital variability seem more erratic. Namely, the observations show that orbital variability has switched seemingly randomly between being symmetrical and having a positive skewness, that is, with the largest fading being shortly after the periastron passage. Hence, if the circumbinary disc variations are indeed behind the cycle-to-cycle variability in HD 213985, clumping or 3D structures in the circumbinary disc seem more likely.
An alternative scenario involves a potential third component in the system, either interacting with the circumbinary disc or influencing the orbital geometry such that the apparent motion of the post-AGB star now trails behind denser regions of the circumbinary disc. However, the system inclination of  (Bollen et al. 2022) and the well-fitted radial velocity curve (Oomen et al. 2018) make the possibility of such a third body remaining undetected unlikely.
Another interpretation of the erratic behaviour of HD 213985 could be proposed based on the Na D absorption component seen in orbital phases ∼0.5−0.7 (Fig. 4). This component has been observed at the radial velocity of the post-AGB star or slightly blueshifted, at orbital phases when the star starts to move away from the observer. This is similar to the behaviour of He Iλ4471 line in a massive interactive binary RY Sct, where it was caused by outflow through L2 Lagrange point (Grundstrom et al. 2007). The same interpretation can be valid for HD 213985, and the cycle-to-cycle orbital shape variability could be explained by interaction of matter ejected through L2 with the circumbinary disc. The strongest outflow would occur during the periastron passage, but it is possible that the average amount of matter lost trough L2 would vary between orbital cycles. However, the post-AGB star in HD 213985 is not filling its Roche Lobe and the exact physics and strength of an outflow through L2 would need to be understood in order to verify this scenario.
Space-based observations have revealed short-term fluctuations of HD 213985. Similar variability on timescales of days has been observed in a few other post-AGB objects (Arkhipova et al. 2012, 2014; Kamiński et al. 2024). Kamiński et al. (2024) speculated that the fast variability in U Equ can be interpreted as flickering, a stochastic variability seen in all types of astrophysical objects with accretion (e.g. Scaringi et al. 2015). However, during TESS sector 2 observations, the amplitude of HD 213985 short-term fluctuations increases when the system fades at the orbital phase ∼0.47 (Fig. 2). This is opposite to what is expected from flickering (e.g. Uttley et al. 2005). Moreover, the light contribution of the circumcompanion disc is estimated to be very minimal (see e.g. Kluska et al. 2018 where for a post-AGB binary IRAS 08544−4431 it is resolved to be 3.9 ± 0.7% in the H-band). Flickering of the circumcompanion disc will therefore not introduce such large amplitude fluctuations as have been observed in HD 213985. On the other hand, Arkhipova et al. (2012) suggested that a similar fast variability in a post-AGB star IRAS 19336−0400 is due to sporadic changes in the mass outflow rate. This interpretation seems to not fit in the case of HD 213985, as we presume the outflow would be the strongest at or near the periastron passage, as it would be enhanced by tidal forces. The opposite seems to be observed in HD 213985, where there is no correlation between the presence of fast variability and the orbital phase. This is best seen by presence of the stochastic variability during TESS sector 2 observations, and its absence at the same orbital phases during the sector 69 monitoring (Fig. 2).
We propose that the short-term fluctuations of HD 213985 may be caused by small dust structures or clumps in the circumbinary disc. Their presumed evolution and movement would cause variable line-of-sight reddening component on top of the orbital motion induced global line-of-sight reddening. Obscuration by irregular dust structures is consistent with the fast variability present during TESS sector 2, where the variability appears when the system suddenly faded, and disappeared when the brightness increased. Similar scenario has been proposed to explain the fast variability of a pre-main sequence binary CoRoT 223992193 (Terquem et al. 2015). Based on the spectroscopic orbit of Oomen et al. (2018), the post AGB star is expected to take approximately five days to pass behind a stationary dust cloud that is significantly smaller than its own radius. This aligns with the timescale of the longer fluctuations, implying the upper limit on the size of the dust structures (Fig. 2). The shorter fluctuations, occurring on a timescale of one day, would need to be explained either by changes in the dust cloud geometry or by dust clouds counter rotating relative to the binary orbit. A lower limit on the dust structures size can be estimated assuming that the dust structures are completely opaque. A fading by 10% suggests that 10% of post-AGB star surface area would be obscured, implying a lower limit of the dust structure radius of  times that of the post-AGB star. Given the post-AGB star radius of 8.6 ± 0.3 R⊙ (Bollen et al. 2022), the expected dust structure radius is in the range 2.6−8.9 R⊙. Fast multi-colour photometry is required to confirm variable line-of-sight reddening as a source of HD 213985 fast variability.
5. Conclusions
HD 213985 was known to exhibit relatively small variations in the shape of orbital variability (Kiss et al. 2007). We have shown that the amplitude of HD 213985 variability increased in the recent years. Moreover, its shape has become more irregular, and the orbital variability has often appeared skewed (Fig. 1). Based on the variability of Na D lines we propose that the variability is caused by eclipse by the inner edge of circumbinary disc that is possibly perturbed by outflow through L2 Lagrange point.
The system experienced short-term fluctuations. This variability seems to appear and disappear seemingly at random. In particular, its presence was not related to the orbital phase. Moreover, it could be detected for ∼70 days in K2 and disappear only six days after its appearance during TESS sector 2 (Fig. 2). The behaviour of fast variability seems consistent with obscuration by small and irregular dust structures, likely located in the circumbinary disc.
The analysis of HD 213985 photometric observations revealed that its behaviour is more complex than previously thought. High-cadance infrared monitoring of the system covering a few orbital cycles is required in order to confirm whether the changes in the orbital variability are caused by variable circumbinary disc. Moreover, simultaneous high-time-resolution spectroscopic and photometric observation are needed to confirm the nature of the short-term fluctuations.
Acknowledgments
This work was supported by Polish National Science Center grant Sonatina 2021/40/C/ST9/00186. L.P. is a FNRS research fellow. Based on observations made with the Mercator Telescope, operated on the island of La Palma by the Flemish Community, at the Spanish Observatorio del Roque de los Muchachos of the Instituto de Astrofísica de Canarias. Based on observations obtained with the HERMES spectrograph, which is supported by the Research Foundation – Flanders (FWO), Belgium, the Research Council of KU Leuven, Belgium, the Fonds National de la Recherche Scientifique (F.R.S.-FNRS), Belgium, the Royal Observatory of Belgium, the Observatoire de Genéve, Switzerland and the Thüringer Landessternwarte Tautenburg, Germany. This research made use of Lightkurve, a Python package for Kepler and TESS data analysis (Lightkurve Collaboration 2018).
References
- Arkhipova, V. P., Burlak, M. A., Esipov, V. F., Ikonnikova, N. P., & Komissarova, G. V. 2012, Astron. Lett., 38, 157 [Google Scholar]
- Arkhipova, V. P., Burlak, M. A., Esipov, V. F., et al. 2014, Astron. Lett., 40, 485 [NASA ADS] [CrossRef] [Google Scholar]
- Bollen, D., Kamath, D., Van Winckel, H., et al. 2022, A&A, 666, A40 [NASA ADS] [CrossRef] [EDP Sciences] [Google Scholar]
- Brasseur, C. E., Phillip, C., Fleming, S. W., Mullally, S. E., & White, R. L. 2019, Astrophysics Source Code Library [record ascl:1905.007] [Google Scholar]
- Corporaal, A., Kluska, J., Van Winckel, H., et al. 2023, A&A, 674, A151 [NASA ADS] [CrossRef] [EDP Sciences] [Google Scholar]
- Gorlova, N., Van Winckel, H., Gielen, C., et al. 2012, A&A, 542, A27 [NASA ADS] [CrossRef] [EDP Sciences] [Google Scholar]
- Grundstrom, E. D., Gies, D. R., Hillwig, T. C., et al. 2007, ApJ, 667, 505 [Google Scholar]
- Houk, N., & Smith-Moore, M. 1988, Michigan Catalogue of Two-dimensional Spectral Types for the HD Stars (Ann Arbor: University of Michigan) [Google Scholar]
- Howell, S. B., Sobeck, C., Haas, M., et al. 2014, PASP, 126, 398 [Google Scholar]
- Hwang, H.-C., & Zakamska, N. L. 2020, MNRAS, 493, 2271 [NASA ADS] [CrossRef] [Google Scholar]
- Jorissen, A., Frankowski, A., Famaey, B., & van Eck, S. 2009, A&A, 498, 489 [NASA ADS] [CrossRef] [EDP Sciences] [Google Scholar]
- Kamiński, T., Schmidt, M. R., Djupvik, A. A., et al. 2024, A&A, 682, A133 [NASA ADS] [CrossRef] [EDP Sciences] [Google Scholar]
- Kiss, L. L., & Bódi, A. 2017, A&A, 608, A99 [NASA ADS] [CrossRef] [EDP Sciences] [Google Scholar]
- Kiss, L. L., Derekas, A., Szabó, G. M., Bedding, T. R., & Szabados, L. 2007, MNRAS, 375, 1338 [NASA ADS] [CrossRef] [Google Scholar]
- Kluska, J., Hillen, M., Van Winckel, H., et al. 2018, A&A, 616, A153 [NASA ADS] [CrossRef] [EDP Sciences] [Google Scholar]
- Kluska, J., Van Winckel, H., Hillen, M., et al. 2019, A&A, 631, A108 [NASA ADS] [CrossRef] [EDP Sciences] [Google Scholar]
- Kluska, J., Van Winckel, H., Coppée, Q., et al. 2022, A&A, 658, A36 [NASA ADS] [CrossRef] [EDP Sciences] [Google Scholar]
- Kochanek, C. S., Shappee, B. J., Stanek, K. Z., et al. 2017, PASP, 129, 104502 [Google Scholar]
- Lightkurve Collaboration (Cardoso, J. V. D. M., et al.) 2018, Astrophysics Source Code Library [record ascl:1812.013] [Google Scholar]
- Mainzer, A., Bauer, J., Grav, T., et al. 2011, ApJ, 731, 53 [Google Scholar]
- Manick, R., Kamath, D., Van Winckel, H., et al. 2019, A&A, 628, A40 [NASA ADS] [CrossRef] [EDP Sciences] [Google Scholar]
- Miller Bertolami, M. M. 2016, A&A, 588, A25 [NASA ADS] [CrossRef] [EDP Sciences] [Google Scholar]
- Munari, U., & Zwitter, T. 1997, A&A, 318, 269 [NASA ADS] [Google Scholar]
- Oomen, G.-M., Van Winckel, H., Pols, O., et al. 2018, A&A, 620, A85 [NASA ADS] [CrossRef] [EDP Sciences] [Google Scholar]
- Oomen, G.-M., Pols, O., Van Winckel, H., & Nelemans, G. 2020, A&A, 642, A234 [NASA ADS] [CrossRef] [EDP Sciences] [Google Scholar]
- Pojmanski, G. 1997, Acta Astron., 47, 467 [Google Scholar]
- Pojmanski, G., & Maciejewski, G. 2005, Acta Astron., 55, 97 [NASA ADS] [Google Scholar]
- Poznanski, D., Prochaska, J. X., & Bloom, J. S. 2012, MNRAS, 426, 1465 [Google Scholar]
- Raskin, G., van Winckel, H., Hensberge, H., et al. 2011, A&A, 526, A69 [CrossRef] [EDP Sciences] [Google Scholar]
- Ricker, G. R., Winn, J. N., Vanderspek, R., et al. 2015, J. Astron. Telesc. Instrum. Syst., 1, 014003 [Google Scholar]
- Şahin, T., & Jeffery, C. S. 2007, Astron. Nachr., 328, 848 [CrossRef] [Google Scholar]
- Scaringi, S., Maccarone, T. J., Kording, E., et al. 2015, Sci. Adv., 1, e1500686 [NASA ADS] [CrossRef] [Google Scholar]
- Shappee, B. J., Prieto, J. L., Grupe, D., et al. 2014, ApJ, 788, 48 [Google Scholar]
- Terquem, C., Sørensen-Clark, P. M., & Bouvier, J. 2015, MNRAS, 454, 3472 [NASA ADS] [CrossRef] [Google Scholar]
- Uttley, P., McHardy, I. M., & Vaughan, S. 2005, MNRAS, 359, 345 [NASA ADS] [CrossRef] [Google Scholar]
- Van Winckel, H. 2016, Proc. Int. Astron. Union, 12, 231 [Google Scholar]
- Van Winckel, H. 2018, ArXiv e-prints [arXiv:1809.00871] [Google Scholar]
- van Winckel, H., Waelkens, C., & Waters, L. B. F. M. 2000, in The Carbon Star Phenomenon, ed. R. F. Wing, 177, 285 [Google Scholar]
- Van Winckel, H., Jorissen, A., Gorlova, N., et al. 2010, Mem. Soc. Astron. Ital., 81, 1022 [Google Scholar]
- Vega, L. D., Stassun, K. G., Montez, R., et al. 2021, ApJ, 909, 138 [NASA ADS] [CrossRef] [Google Scholar]
- Waelkens, C., Waters, L. B. F. M., Cassatella, A., Le Bertre, T., & Lamers, H. J. G. L. M. 1987, A&A, 181, L5 [NASA ADS] [Google Scholar]
- Waelkens, C., Waters, L. B. F. M., van Winckel, H., & Daems, K. 1995, Ap&SS, 224, 357 [Google Scholar]
- Whitelock, P. A., Menzies, J. W., Catchpole, R. M., et al. 1989, MNRAS, 241, 393 [Google Scholar]
- Wright, E. L., Eisenhardt, P. R. M., Mainzer, A. K., et al. 2010, AJ, 140, 1868 [Google Scholar]
Appendix A: Ground-based photometry
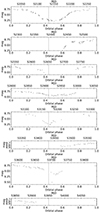 |
Fig. A.1. Phase plots of each observed orbital cycle. The data was plotted against the HD 213985 orbital ephemeris of Oomen et al. (2018), where phase zero corresponds to the periastron passage and the dotted lines mark the phase of inferior conjunction (post-AGB star closest to the observer). Black and green points are datapoints in V and g filters, respectively. The grey areas mark the times of K2 and TESS observations. |
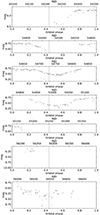 |
Fig. A.1. Continued. |
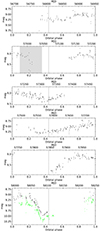 |
Fig. A.1. Continued. |
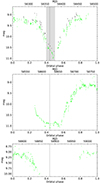 |
Fig. A.1. Continued. |
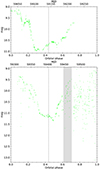 |
Fig. A.1. Continued. |
All Figures
|
Fig. 1. Ground-based light curve of HD 213985. Black and green points represent observations in the V and g filters, respectively. The grey lines indicate an orbital phase of zero, corresponding to the times of periastron passage (Oomen et al. 2018). The data quality declines after MJD = 59300, with increased instrumental scatter. |
| In the text | |
|
Fig. 2. Observations from K2 and TESS sectors 2, 42, and 69. The data were plotted against the HD 213985 orbital ephemeris of Oomen et al. (2018), where phase zero corresponds to the periastron passage and the dotted lines mark the phase of inferior conjunction (post-AGB star is closest to the observer). The fluxes were normalized to the mean flux in each dataset. The decrease in brightness at the orbital phase of 0.49 and a larger scatter of data at the time of inferior conjunction in TESS sector 69 data are likely instrumental artefacts. |
| In the text | |
|
Fig. 3. WISE photometric measurements (red points). Left panels: Full light curve. Right panels: Phase plot of WISE observations made after MJD 56000 using the orbital ephemeris of Oomen et al. (2018), where the dotted lines mark the phase of inferior conjunction (post-AGB star closest to the observer). |
| In the text | |
|
Fig. 4. Dynamical spectra of Na D lines. Top panels show the two Na D lines. Bottom panels show the same spectra after subtracting the average spectrum at orbital phases ±0.08 of the periastron passage. The red line represents the post-AGB component radial velocity curve according to the spectroscopic orbit of Oomen et al. (2018). The systemic radial velocity is marked with a dashed blue line, and the time of inferior conjunction is marked with a dashed black line. Orbital phase 0.0 corresponds to the periastron passage. The green line marks a time of enhanced absorption from the circumbinary disc component (hereafter region A). |
| In the text | |
|
Fig. A.1. Phase plots of each observed orbital cycle. The data was plotted against the HD 213985 orbital ephemeris of Oomen et al. (2018), where phase zero corresponds to the periastron passage and the dotted lines mark the phase of inferior conjunction (post-AGB star closest to the observer). Black and green points are datapoints in V and g filters, respectively. The grey areas mark the times of K2 and TESS observations. |
| In the text | |
|
Fig. A.1. Continued. |
| In the text | |
|
Fig. A.1. Continued. |
| In the text | |
|
Fig. A.1. Continued. |
| In the text | |
|
Fig. A.1. Continued. |
| In the text | |
Current usage metrics show cumulative count of Article Views (full-text article views including HTML views, PDF and ePub downloads, according to the available data) and Abstracts Views on Vision4Press platform.
Data correspond to usage on the plateform after 2015. The current usage metrics is available 48-96 hours after online publication and is updated daily on week days.
Initial download of the metrics may take a while.