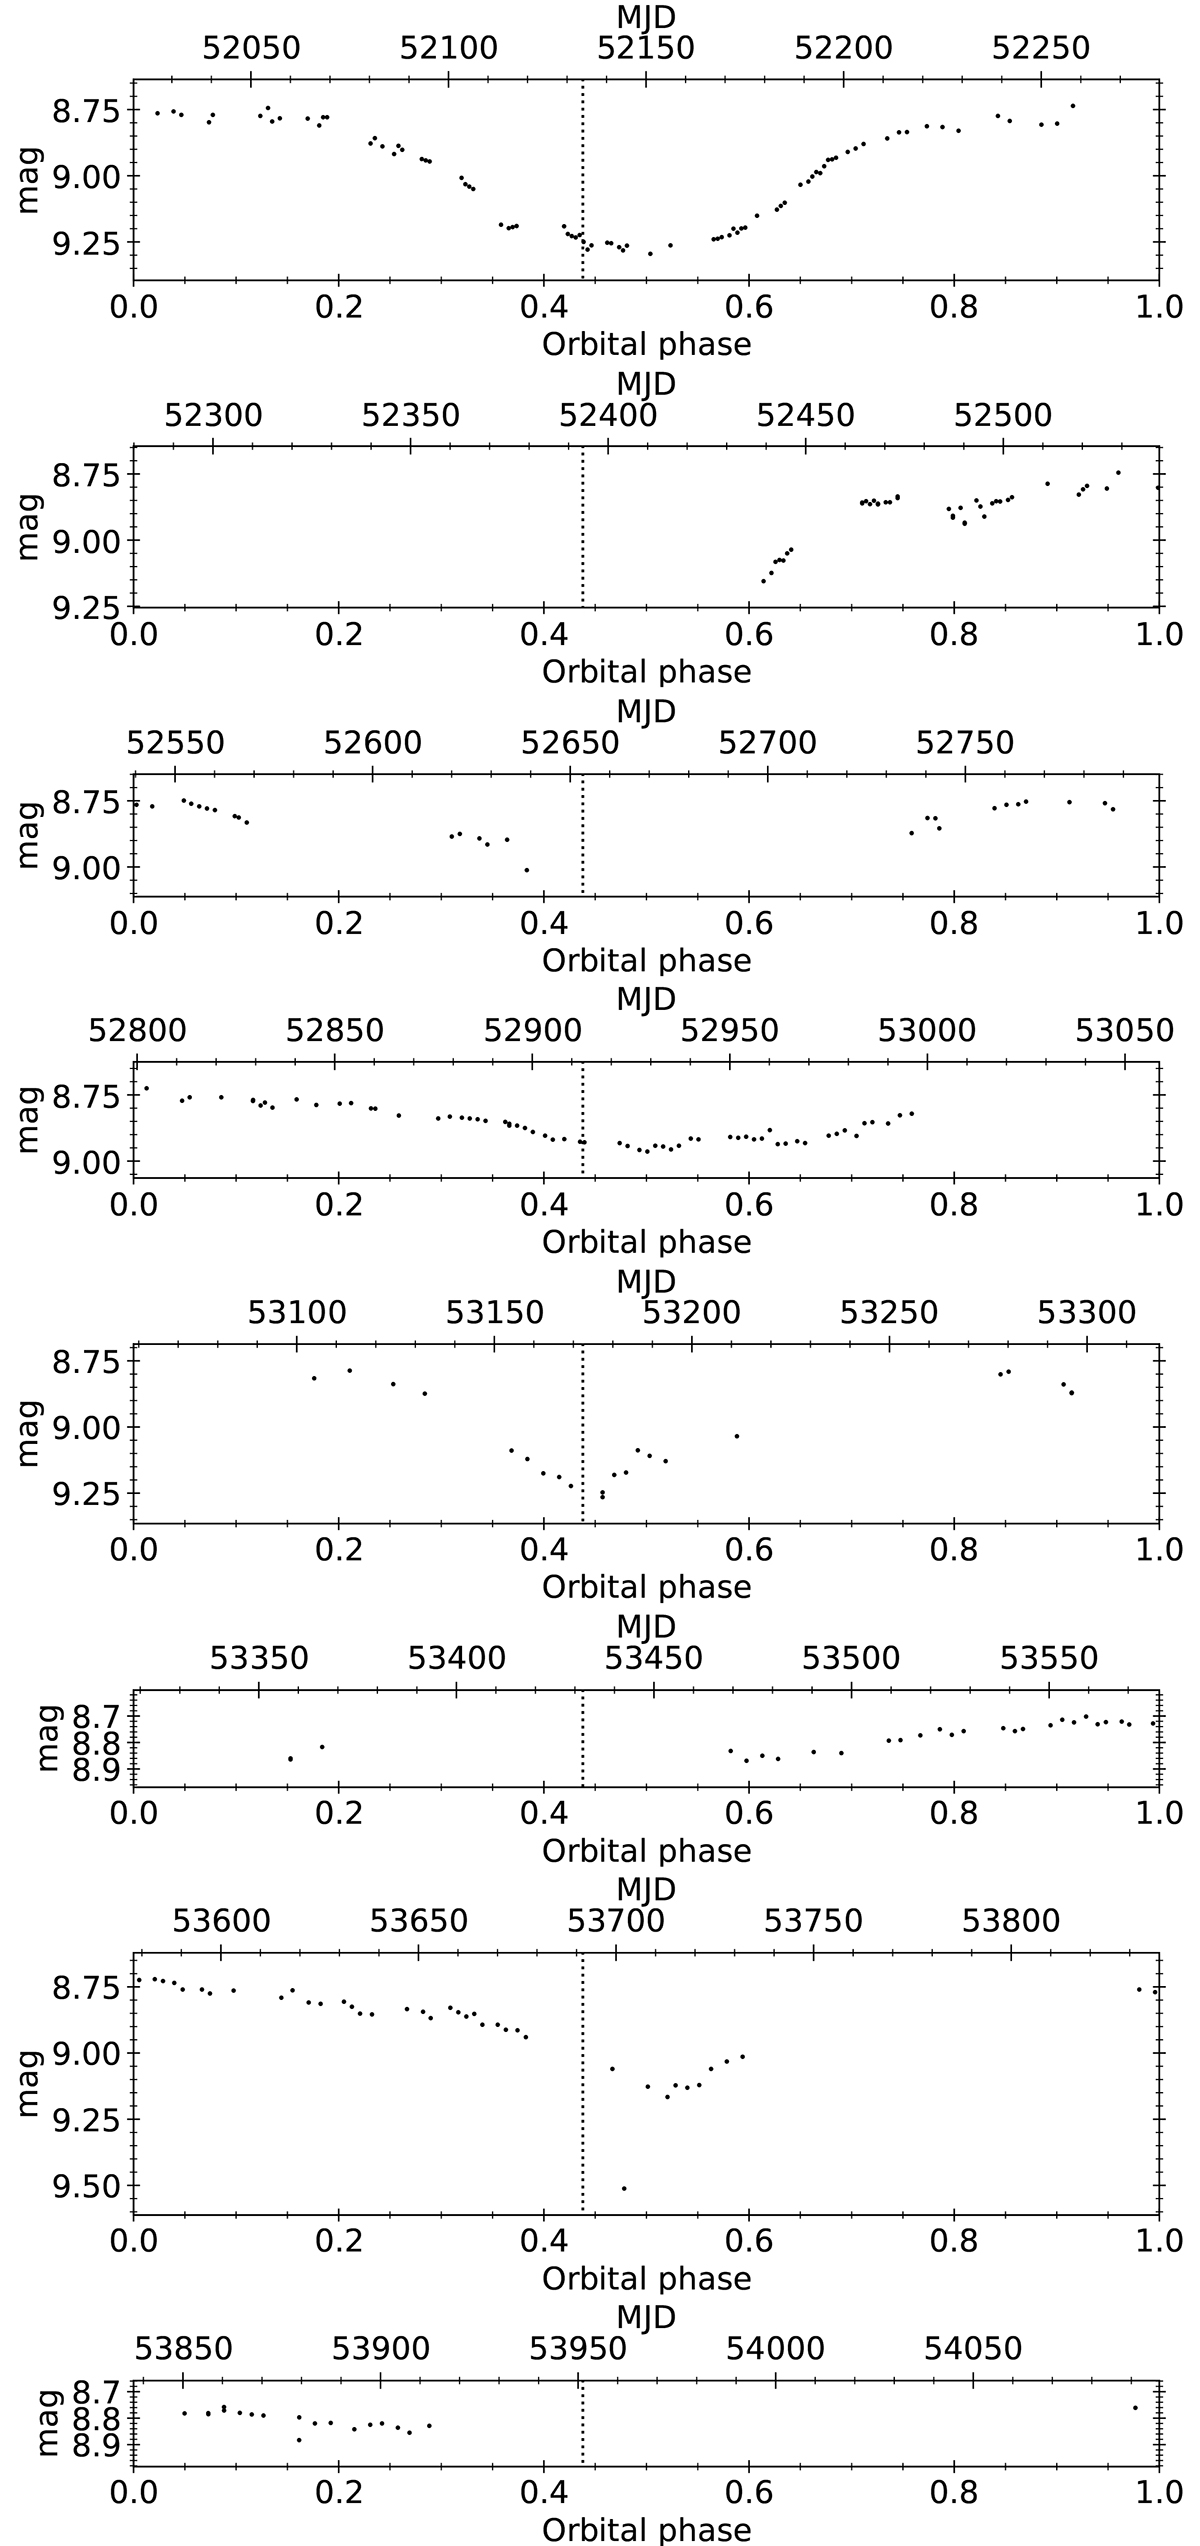
Fig. A.1.

Download original image
Phase plots of each observed orbital cycle. The data was plotted against the HD 213985 orbital ephemeris of Oomen et al. (2018), where phase zero corresponds to the periastron passage and the dotted lines mark the phase of inferior conjunction (post-AGB star closest to the observer). Black and green points are datapoints in V and g filters, respectively. The grey areas mark the times of K2 and TESS observations.
Current usage metrics show cumulative count of Article Views (full-text article views including HTML views, PDF and ePub downloads, according to the available data) and Abstracts Views on Vision4Press platform.
Data correspond to usage on the plateform after 2015. The current usage metrics is available 48-96 hours after online publication and is updated daily on week days.
Initial download of the metrics may take a while.


