Fig. 4.
Download original image
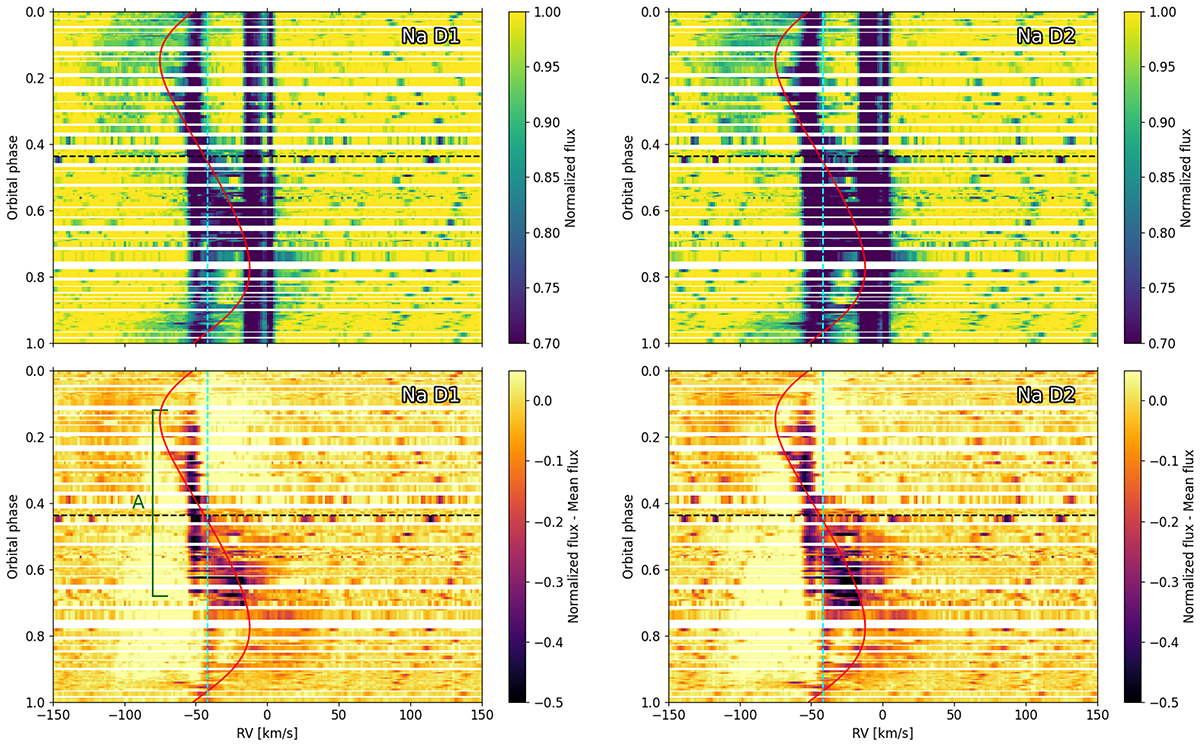
Dynamical spectra of Na D lines. Top panels show the two Na D lines. Bottom panels show the same spectra after subtracting the average spectrum at orbital phases ±0.08 of the periastron passage. The red line represents the post-AGB component radial velocity curve according to the spectroscopic orbit of Oomen et al. (2018). The systemic radial velocity is marked with a dashed blue line, and the time of inferior conjunction is marked with a dashed black line. Orbital phase 0.0 corresponds to the periastron passage. The green line marks a time of enhanced absorption from the circumbinary disc component (hereafter region A).
Current usage metrics show cumulative count of Article Views (full-text article views including HTML views, PDF and ePub downloads, according to the available data) and Abstracts Views on Vision4Press platform.
Data correspond to usage on the plateform after 2015. The current usage metrics is available 48-96 hours after online publication and is updated daily on week days.
Initial download of the metrics may take a while.