Open Access
Fig. 1.
Download original image
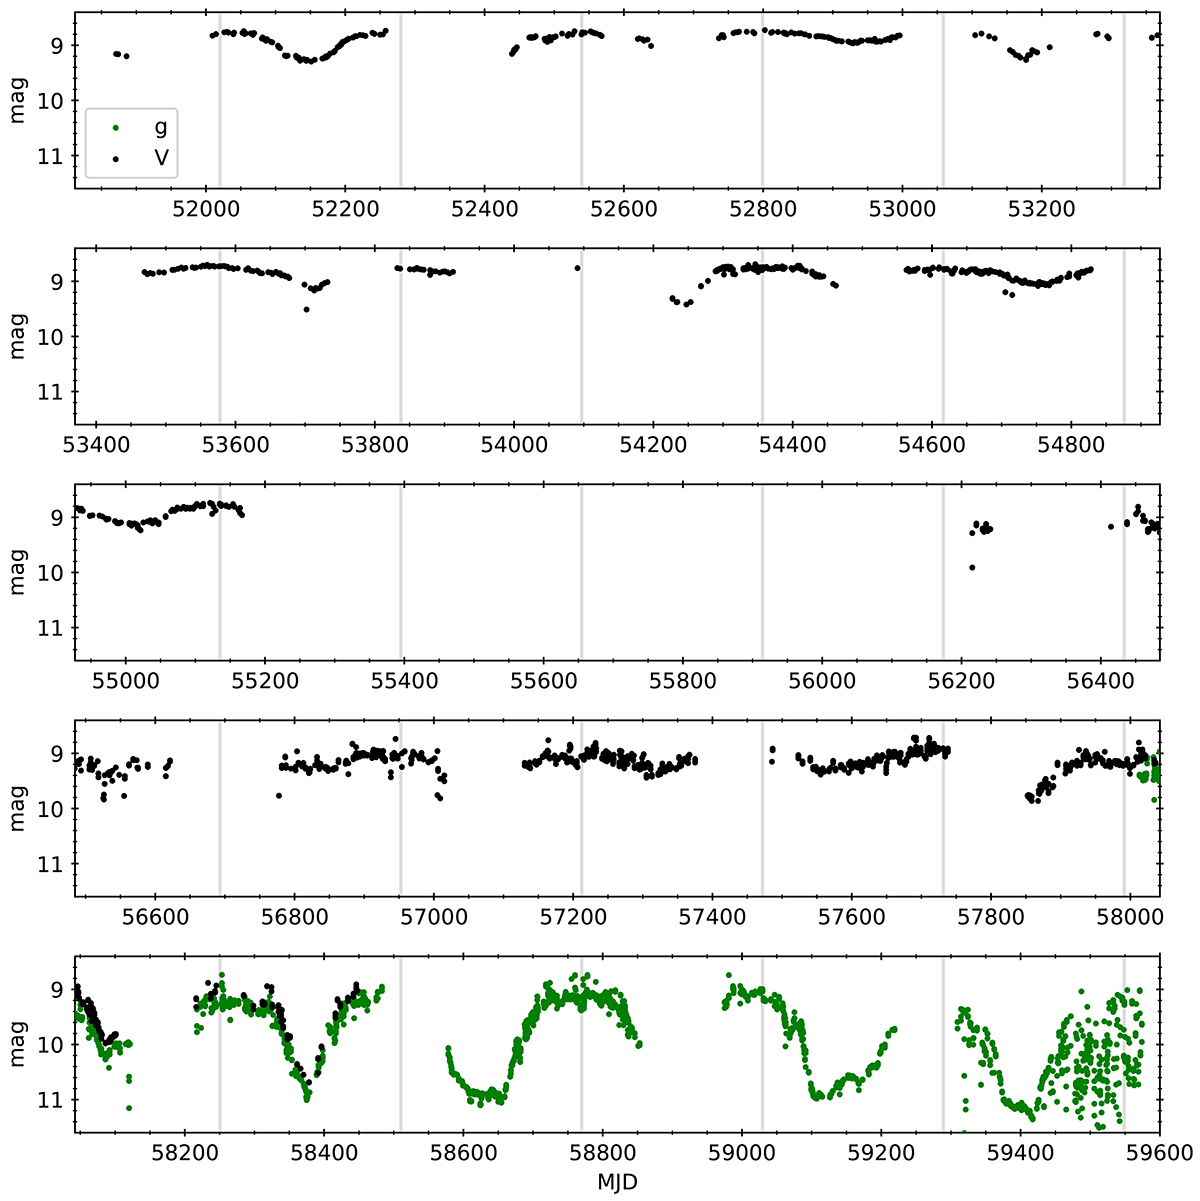
Ground-based light curve of HD 213985. Black and green points represent observations in the V and g filters, respectively. The grey lines indicate an orbital phase of zero, corresponding to the times of periastron passage (Oomen et al. 2018). The data quality declines after MJD = 59300, with increased instrumental scatter.
Current usage metrics show cumulative count of Article Views (full-text article views including HTML views, PDF and ePub downloads, according to the available data) and Abstracts Views on Vision4Press platform.
Data correspond to usage on the plateform after 2015. The current usage metrics is available 48-96 hours after online publication and is updated daily on week days.
Initial download of the metrics may take a while.